🌍 Public
CSCE 5320 Assignment 7
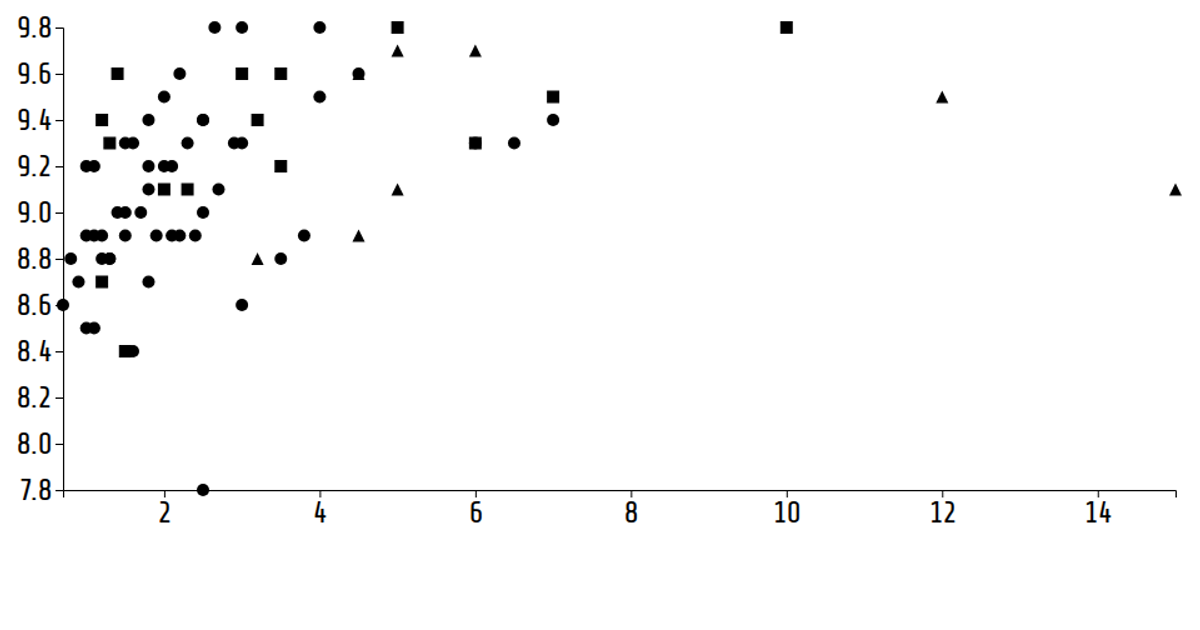
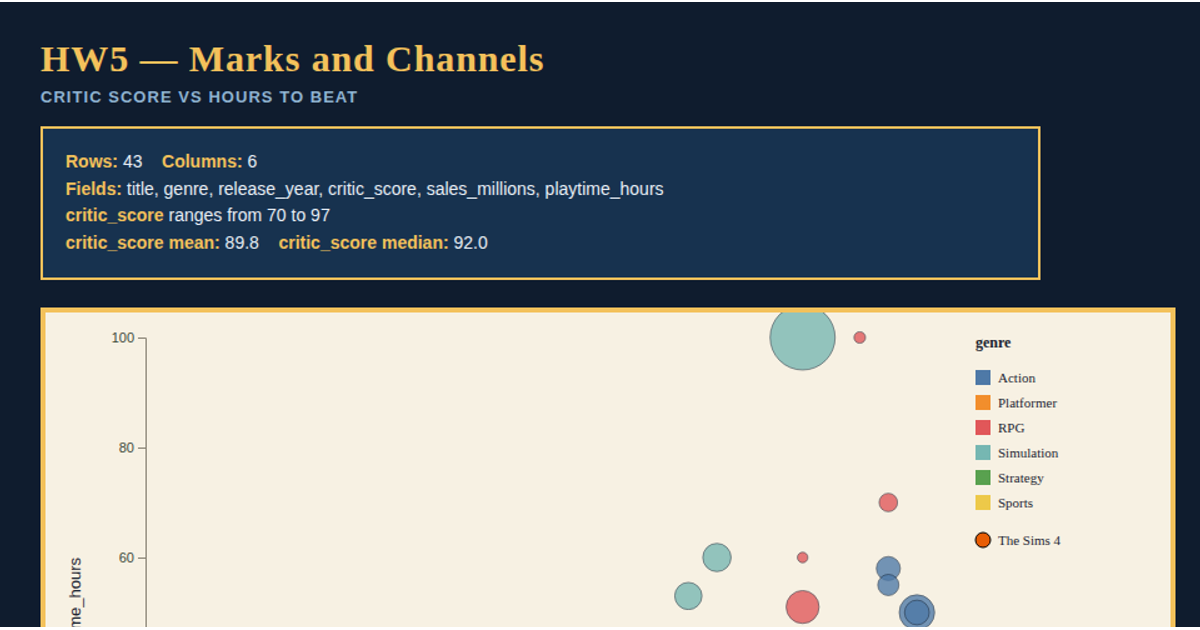
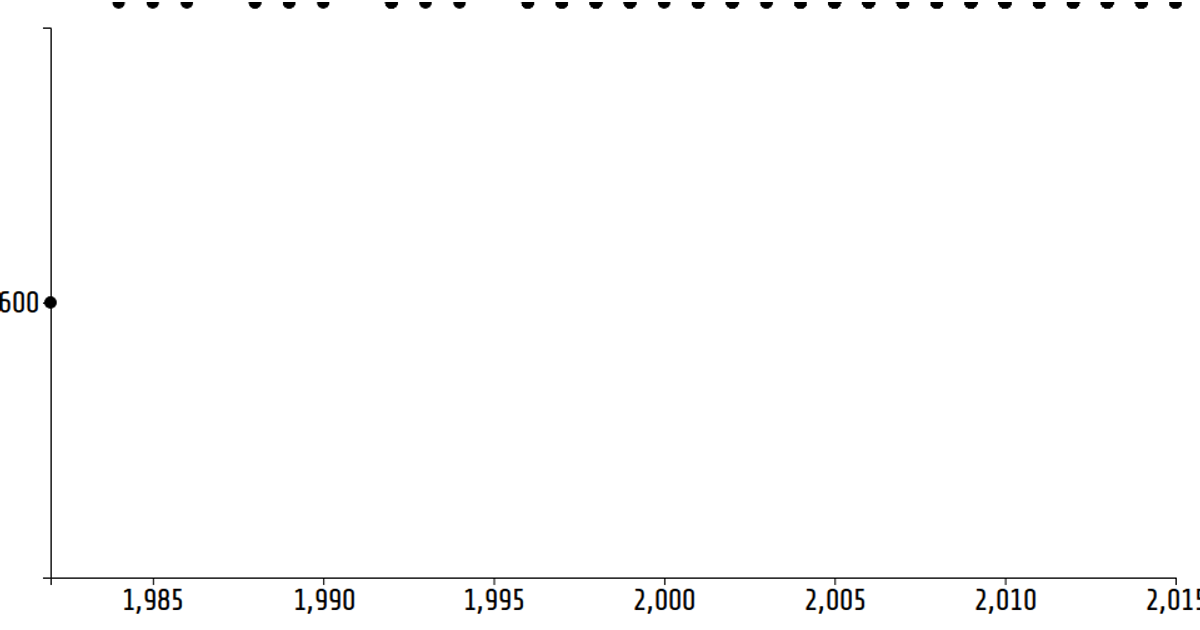
This interactive visualization explores video game sales data through four coordinated charts: a scatter plot of regional sales, a pie chart of genre shares, a line chart, and an area chart of global sales over time. Users switch between views using buttons. Built with D3 v6, the example uses `scaleLinear`, `axisLeft`, `axisBottom`, `pie`, `arc`, `line`, and `area` APIs. The scatter plot employs `scaleOrdinal` with `interpolateRainbow` for genre colors, while the line and area charts aggregate data via `rollup` and `sum` from a TSV dataset.
AI-generated descriptionMIT Licensed





Comments
Sign in to join the discussion.