🌍 Public
Rendering of UN pop
LLainu Kuruvilla
Last edited Jan 13, 2022
Created on Jan 12, 2022
Forked from Fork of Rendering data using react and D3
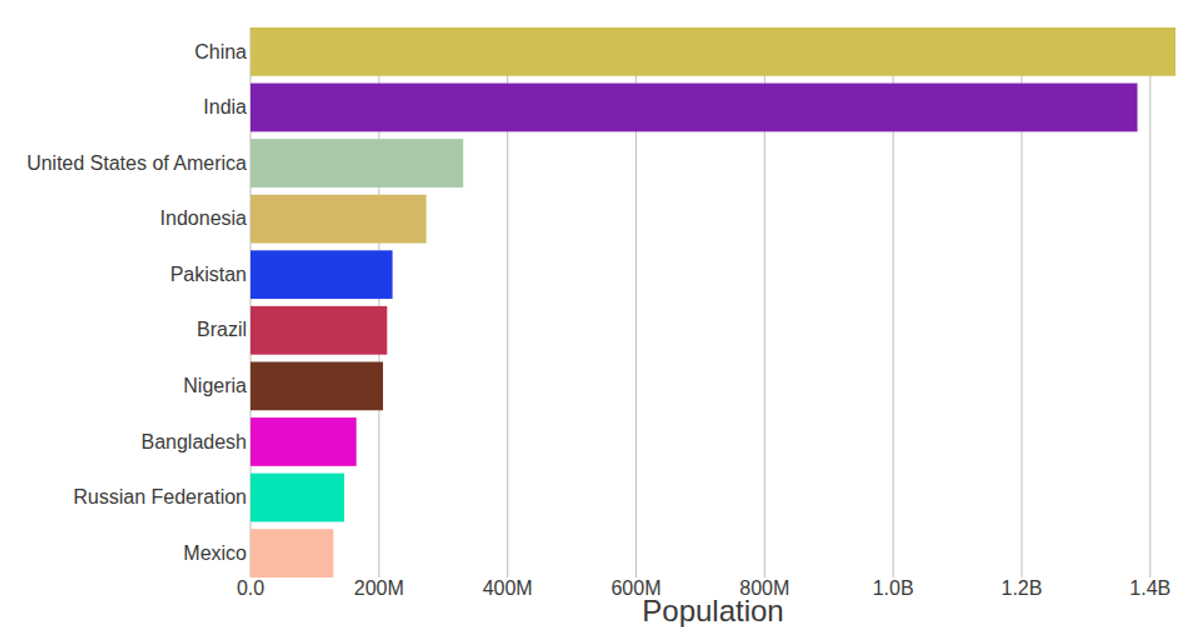
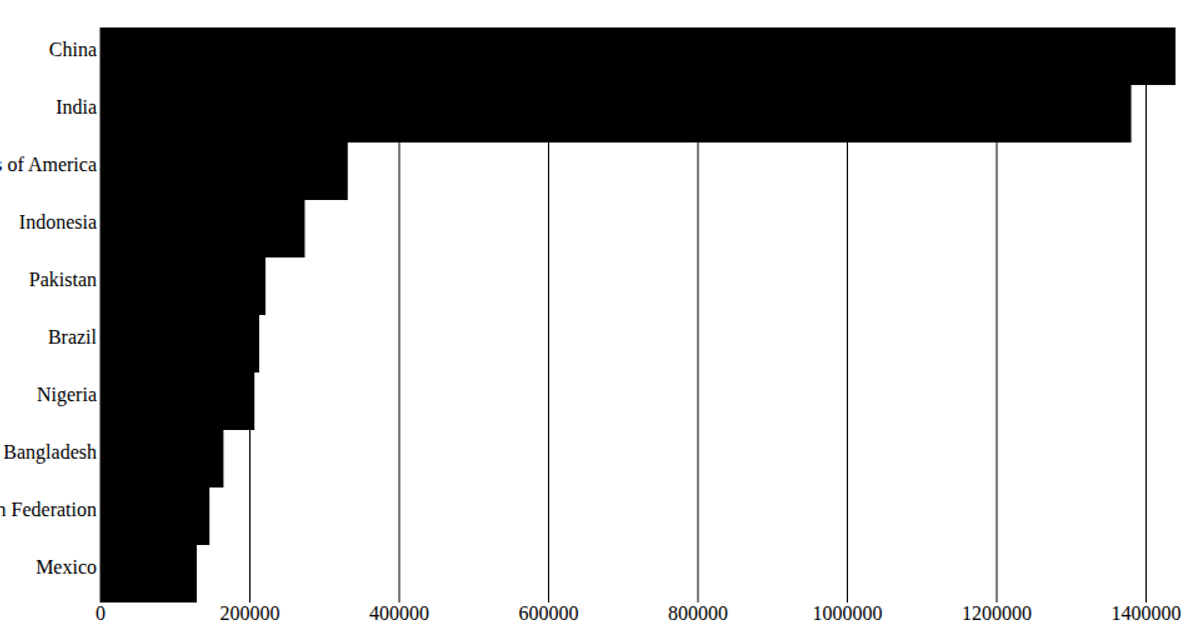
This example renders a horizontal bar chart of the top ten countries by population, using data from the UN’s 2020 population estimates fetched via `d3.csv`. It shows each country’s population as a bar, with the chart built in React and D3 v7. The code computes scales with `scaleBand` for the categorical country axis and `scaleLinear` for the numeric population axis, then draws SVG `<rect>` elements for each bar. Rendering is handled declaratively through React state and the `d3.csv` promise.
AI-generated descriptionRendering data using react and D3
MIT Licensed





Comments
Sign in to join the discussion.