🌍 Public
Rendering un-population data with React & D3
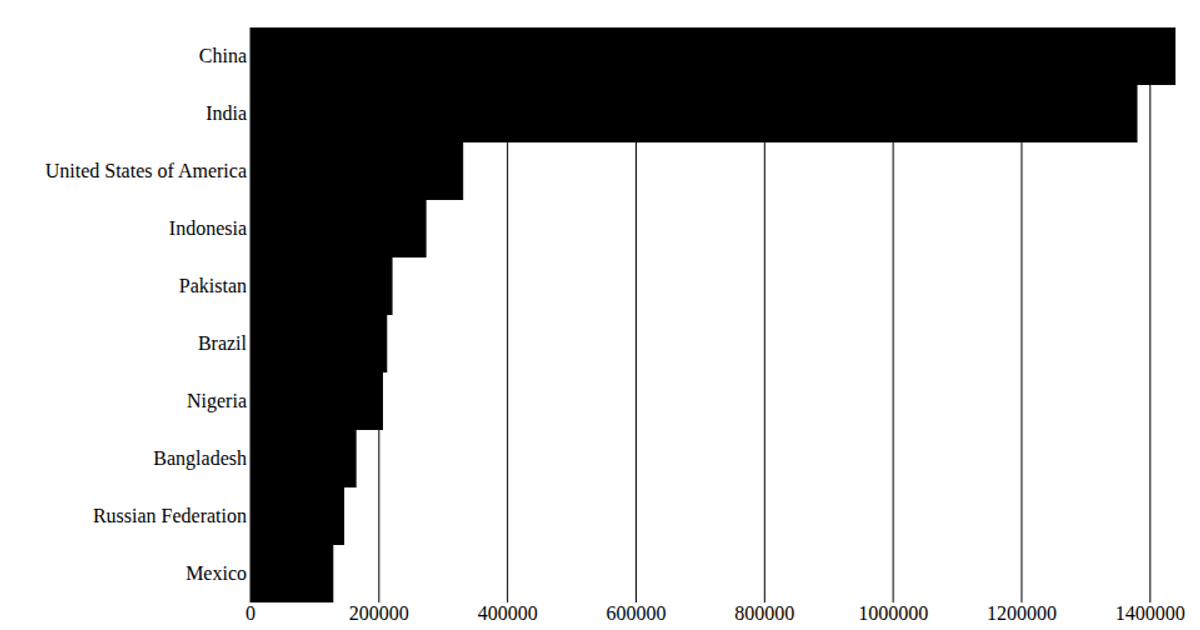
This example shows a horizontal bar chart of the top 10 countries by 2020 population, using React state to manage the data and D3 scales to position the bars. It loads the un-population CSV via `d3.csv`, maps the population values, and renders SVG rectangles with `scaleBand` and `scaleLinear`. Grid lines and tick labels are generated from `xScale.ticks()`. The chart uses React hooks (`useState`, `useEffect`) to fetch and update the data, with D3 v6 providing the scaling and CSV parsing utilities.
AI-generated descriptionA program that loads in some data about CSS named colors using D3 utilities and uses React state to render the data.
MIT Licensed







Comments
Sign in to join the discussion.