🌍 Public
SANKEY Experiment
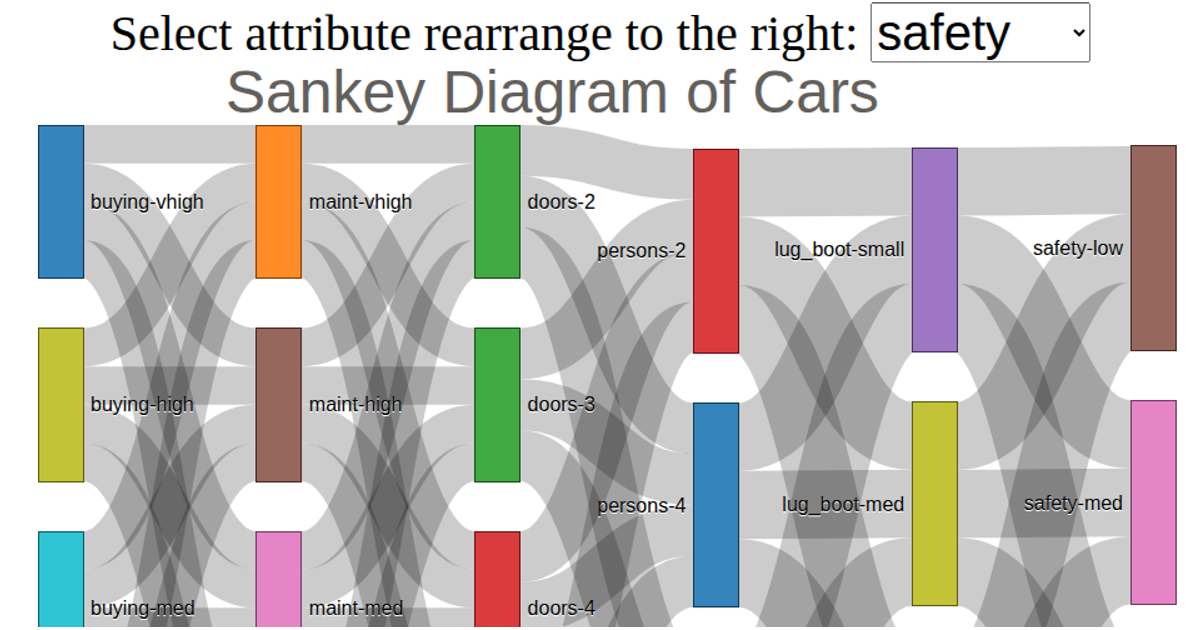
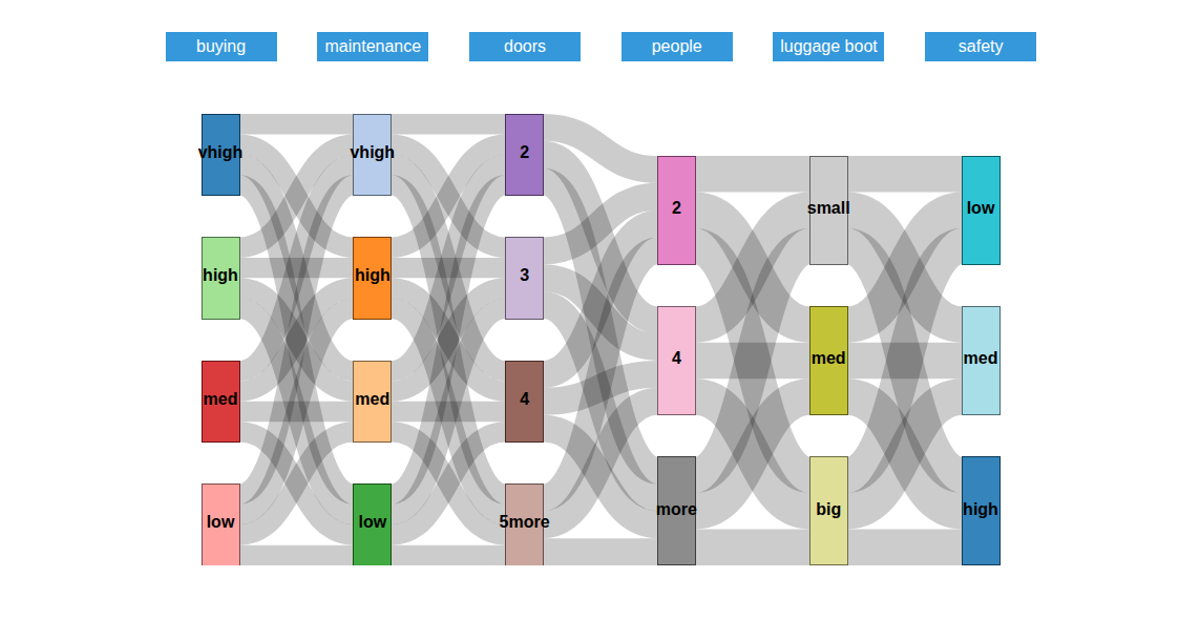
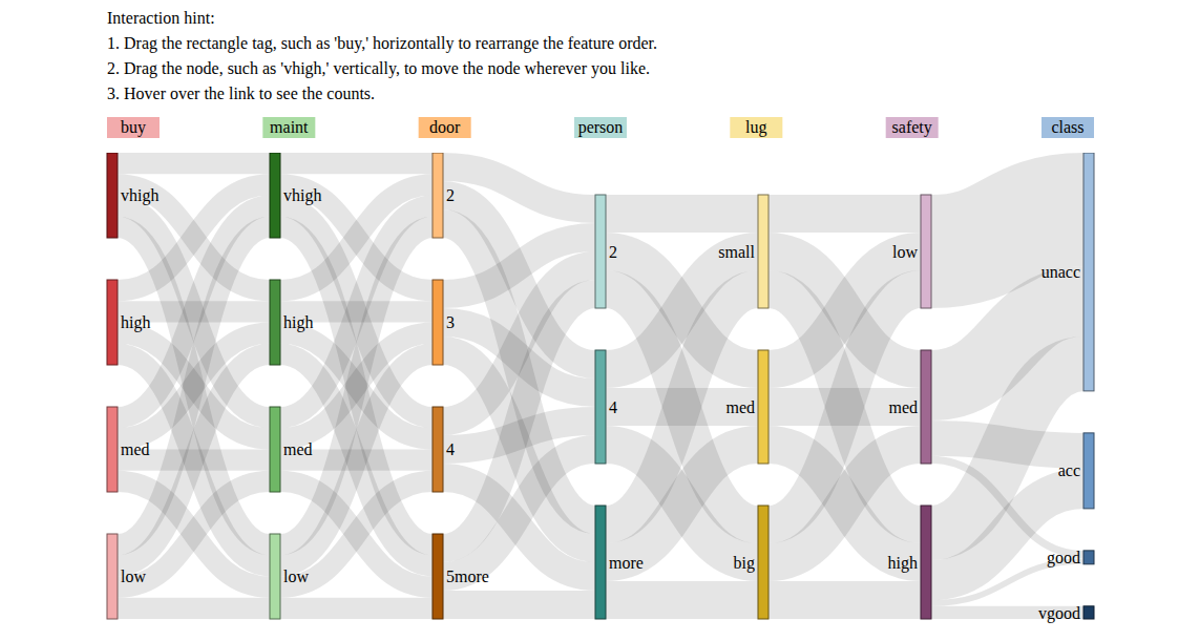
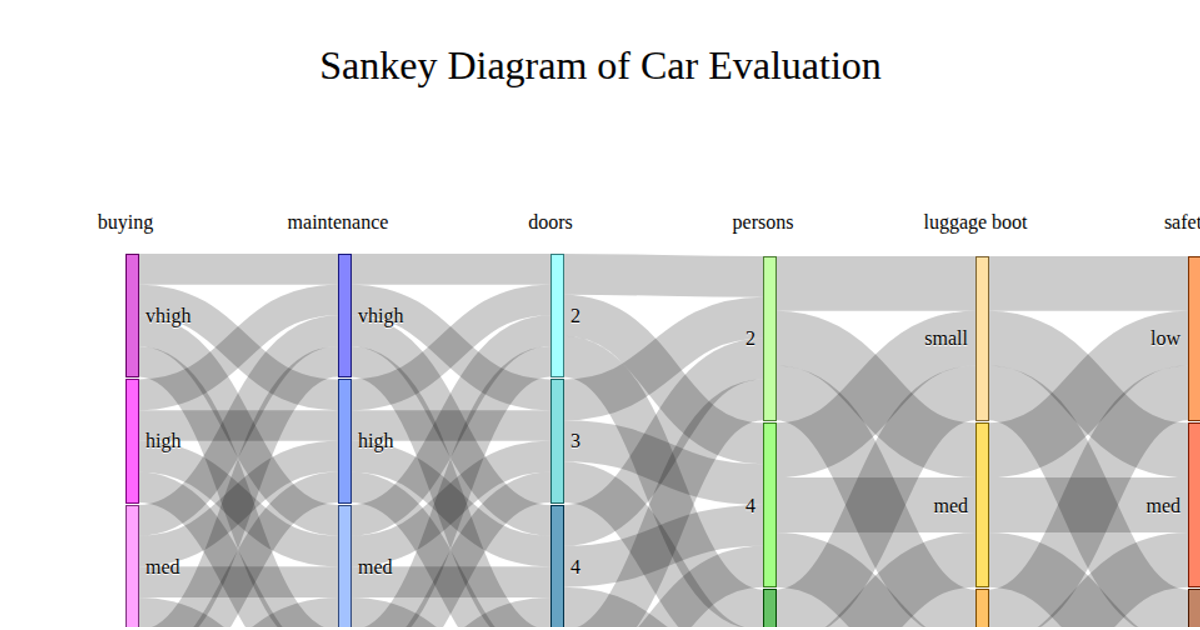
This Sankey diagram visualizes the flow of categorical values across six attributes—buying, maintenance, doors, persons, luggage boot, and safety—from the car.data dataset. Nodes are colored by attribute using the `d3.scaleOrdinal` scheme, with labels and values displayed. The graph is constructed using a custom `d3.sankey()` implementation, with node dragging enabled via `d3.drag()`. The layout is computed through iterative breadth and depth algorithms, rendering SVG paths for links.
AI-generated descriptionAn example showing the capabilities of VizHub:
- Loads D3 via UNPKG.
- Demonstrates use of
importfrom"d3". - Demonstrates use of
importfrom local ES6 modules.
MIT Licensed



Comments
Sign in to join the discussion.