🌍 Public
d3 Choropleth Map
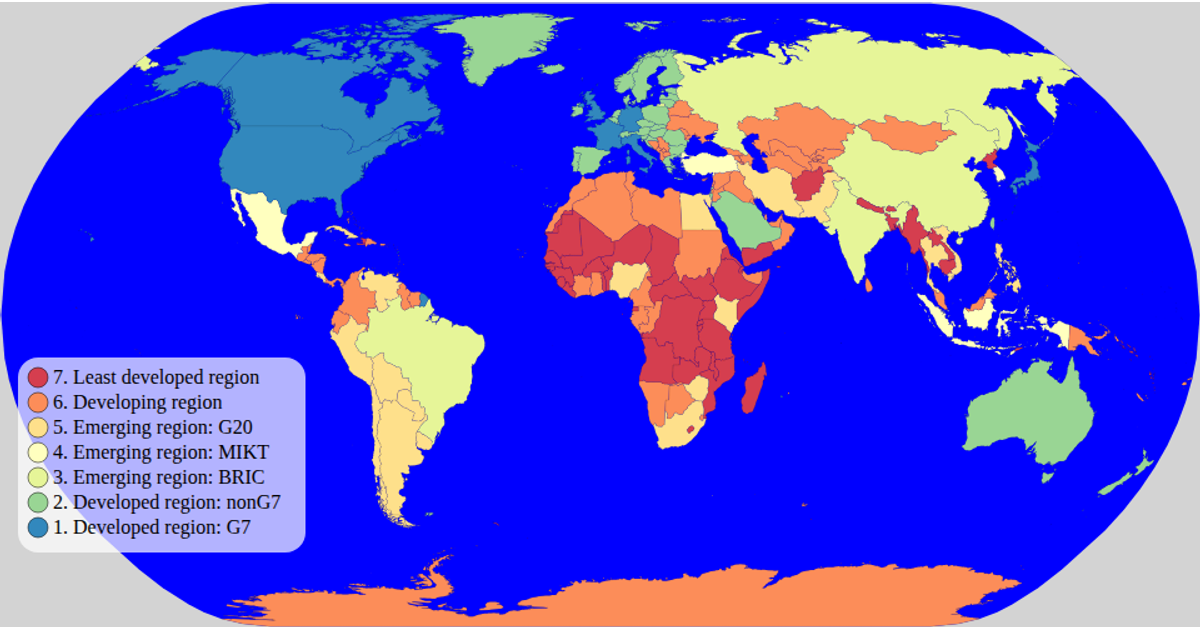
This d3 Choropleth Map visualizes world countries colored by their economic classification from a World Atlas dataset. It uses an SVG rendering with a natural Earth projection and a spectral color scale for the legend. The code employs `d3.geoPath`, `d3.geoNaturalEarth1`, and `topojson.feature` to process and draw the map, while `d3.scaleOrdinal` and `schemeSpectral` define the color categories. A custom legend component displays the color scale with circles and labels, and hovering a country turns it red.
AI-generated descriptionMIT Licensed




Comments
Sign in to join the discussion.