🌍 Public
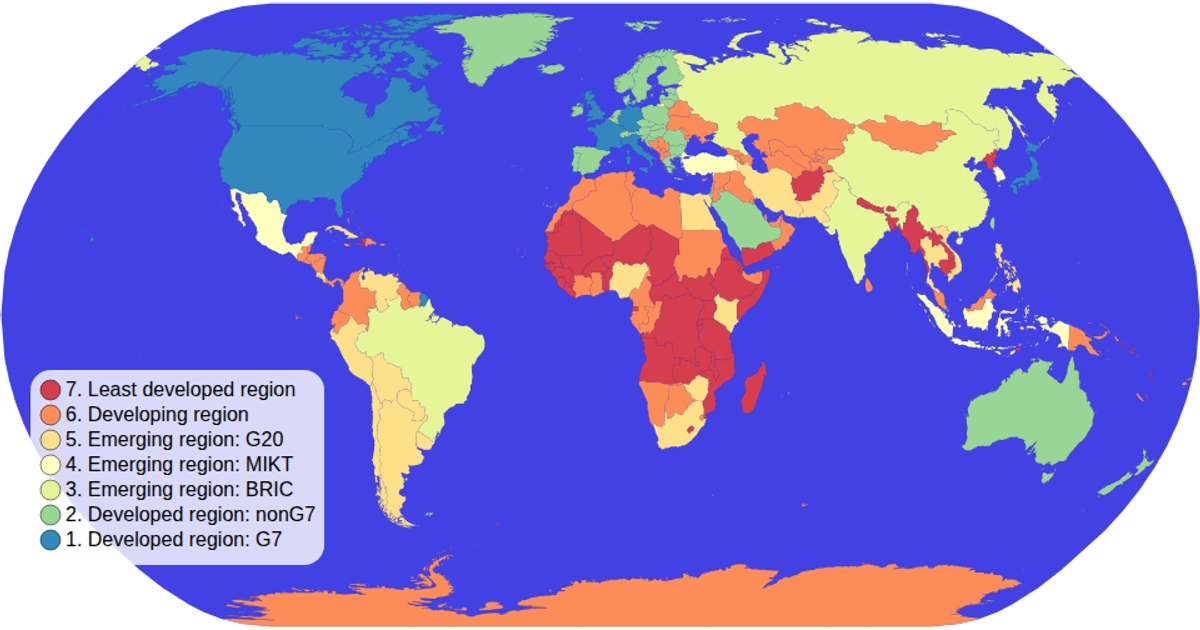
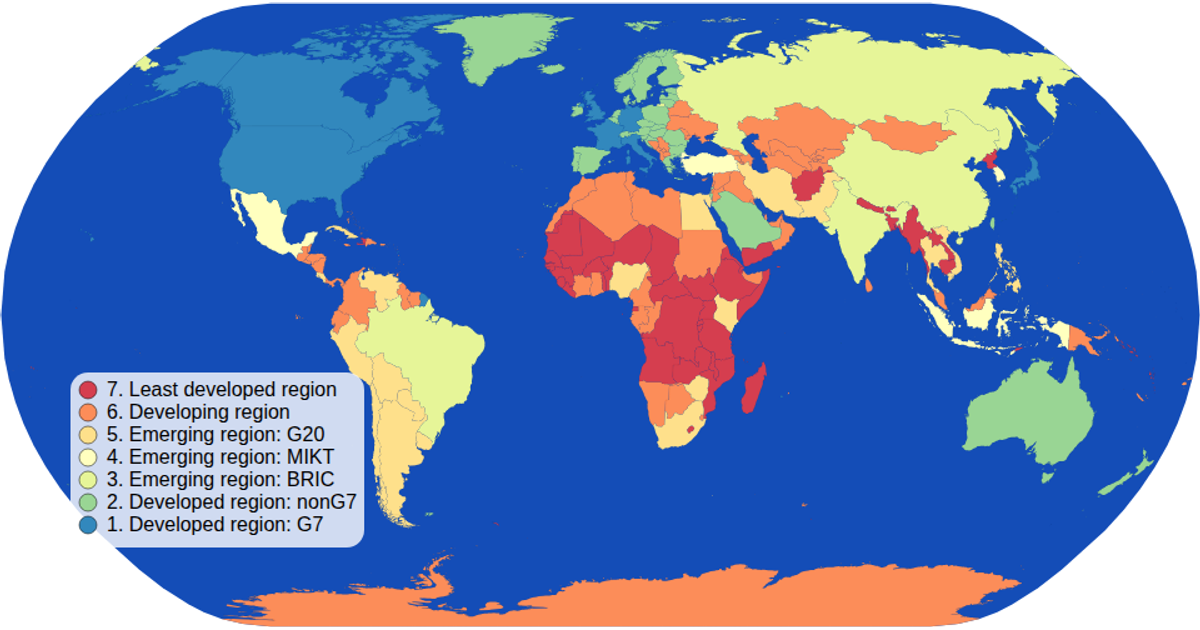
d3 Choropleth Map with Interactive Filtering
Jjayjoepark
Last edited Mar 26, 2019
Created on Mar 26, 2019
Forked from d3 Choropleth Map with Interactive Filtering
This choropleth map displays world countries colored by economic classification, with a legend that filters the map by clicking a category. It uses d3.geoPath with a natural Earth projection to render the countries from a TopoJSON file. The colorLegend component uses d3.scaleOrdinal and schemeSpectral for the color scale, and clicking a legend item reduces the opacity of non-matching countries while highlighting the selected ones.
AI-generated descriptionMIT Licensed




Comments
Sign in to join the discussion.