🌍 Public
Marketing Data Bubble Chart
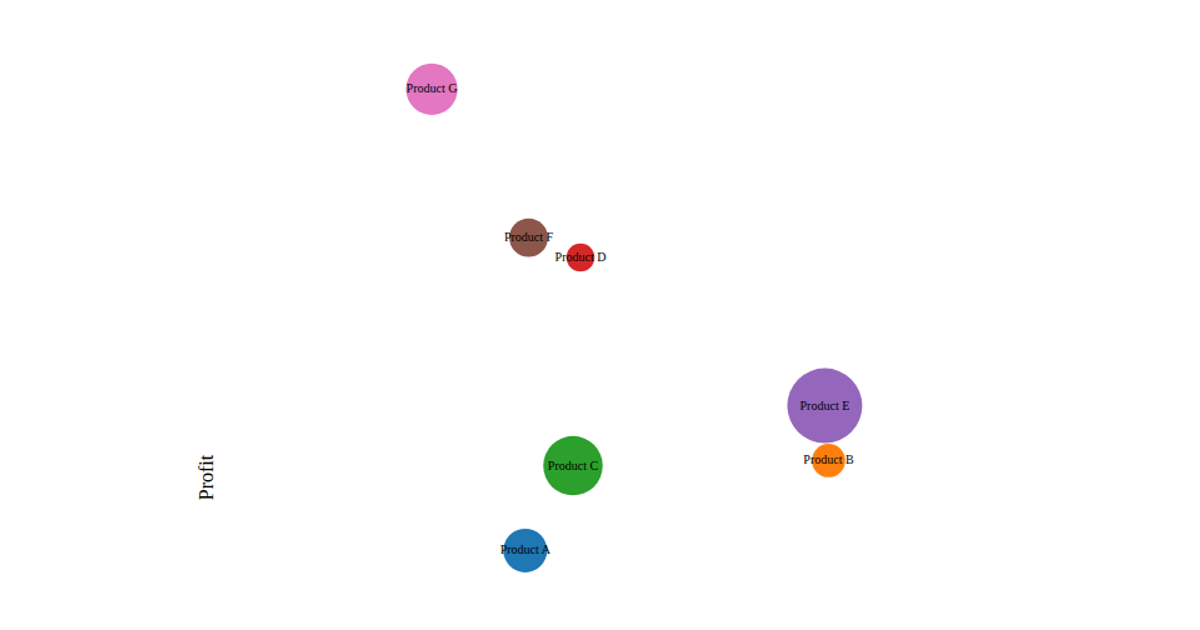
This D3.js v7 bubble chart visualizes marketing campaign performance by plotting clicks on the x-axis and conversions on the y-axis, with each circle’s radius scaled to its budget. The SVG output uses `d3.scaleLinear` for axes, `d3.scaleOrdinal` with `d3.schemeCategory10` for categorical coloring, and a static legend listing each campaign. The chart renders a hardcoded array of ten campaigns, encoding three numeric variables through position and area.
AI-generated descriptionMIT Licensed




Comments
Sign in to join the discussion.