Resources
Contact
Pricing
🇺🇸
EN
Log in
Open Editor
Revision History
Export Image
Share
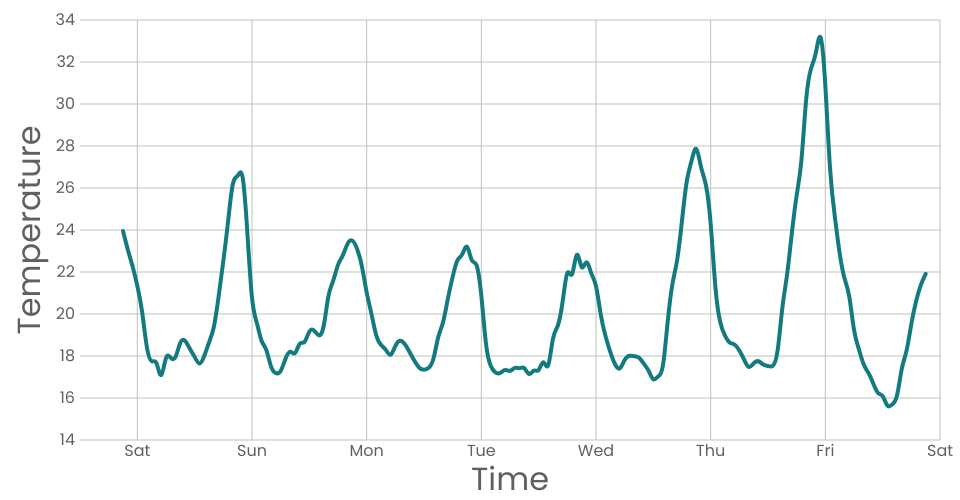
Line Graph React & D3 (codeAlong)
2
Forks
0
Likes
tomahawk-jupiter
0 views in last 90 days
Last edited Jun 06, 2021
Created on Jun 05, 2021
Forked from
Scatter Plot React & D3 (codeAlong)
uses
v2 runtime
Changing the scatter plot to take in new data with time being on the x axis.
MIT Licensed