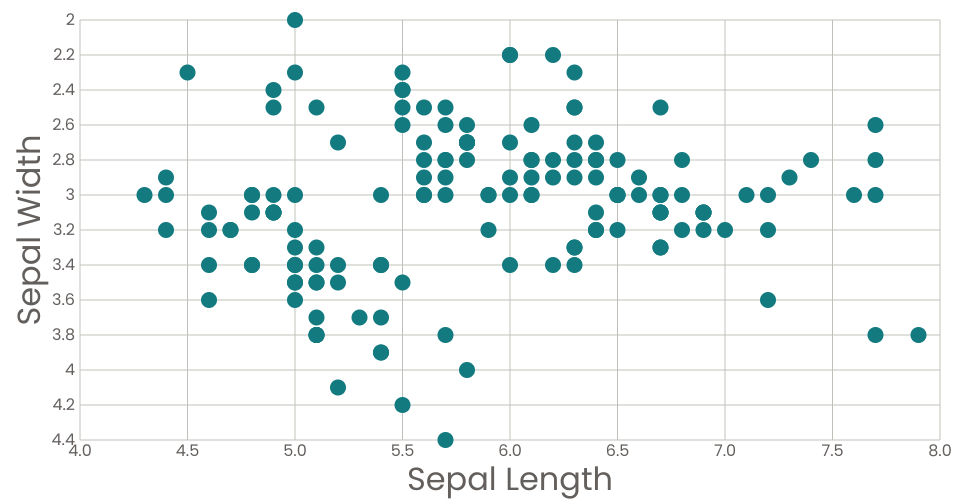
A program that loads in some data about iris flower proportions using d3 utilities and uses React state to keep track of that data.
Using useEffect from React stops the data from loading repeatedly with every state change. Without this it will re-load constantly.
Use React to render the data onto the page into a scatter plot to help see correlations in the data.
MIT Licensed