🌍 Public
Refactored Bar Chart
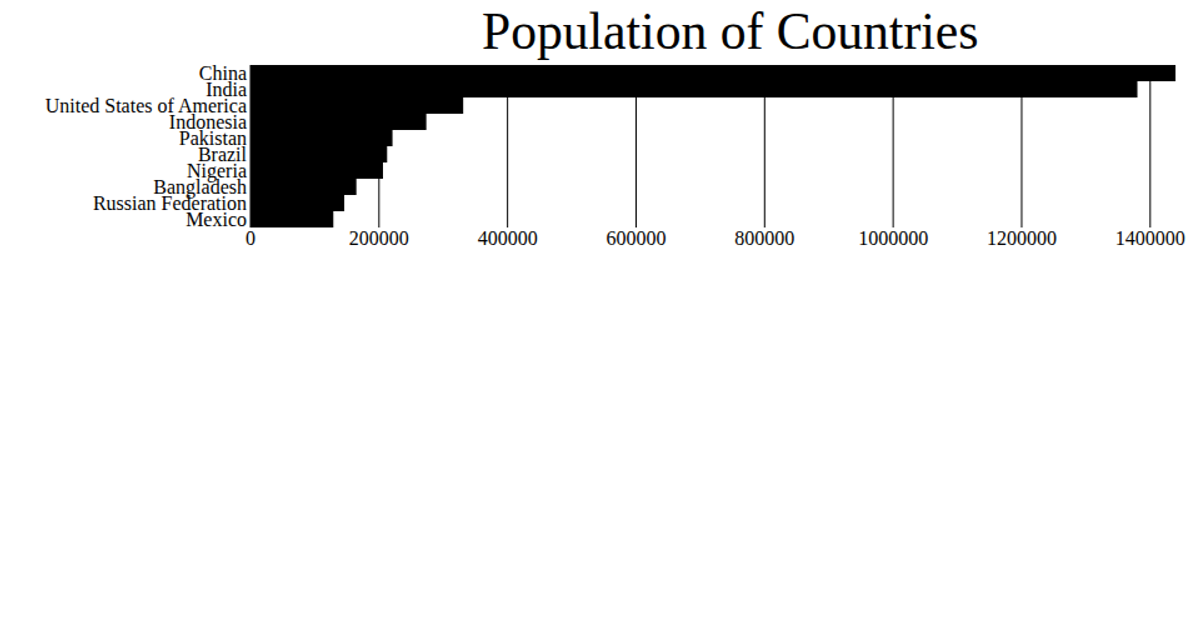
This example displays a horizontal bar chart of the top nine countries by 2020 population, with country names on the y-axis and population on the x-axis. The React app uses a custom `useData` hook to fetch CSV data via D3’s `csv` utility, then renders SVG with D3 scales (`scaleBand` and `scaleLinear`) and helper components for axes and marks. The `Marks` component creates `rect` elements for each bar, while the axis components generate tick lines and text labels.
AI-generated descriptionA program that loads in some data about CSS named colors using D3 utilities, and uses React state to keep track of the data.
MIT Licensed



Comments
Sign in to join the discussion.