🌍 Public
ScatterPlot of Iris Dataset
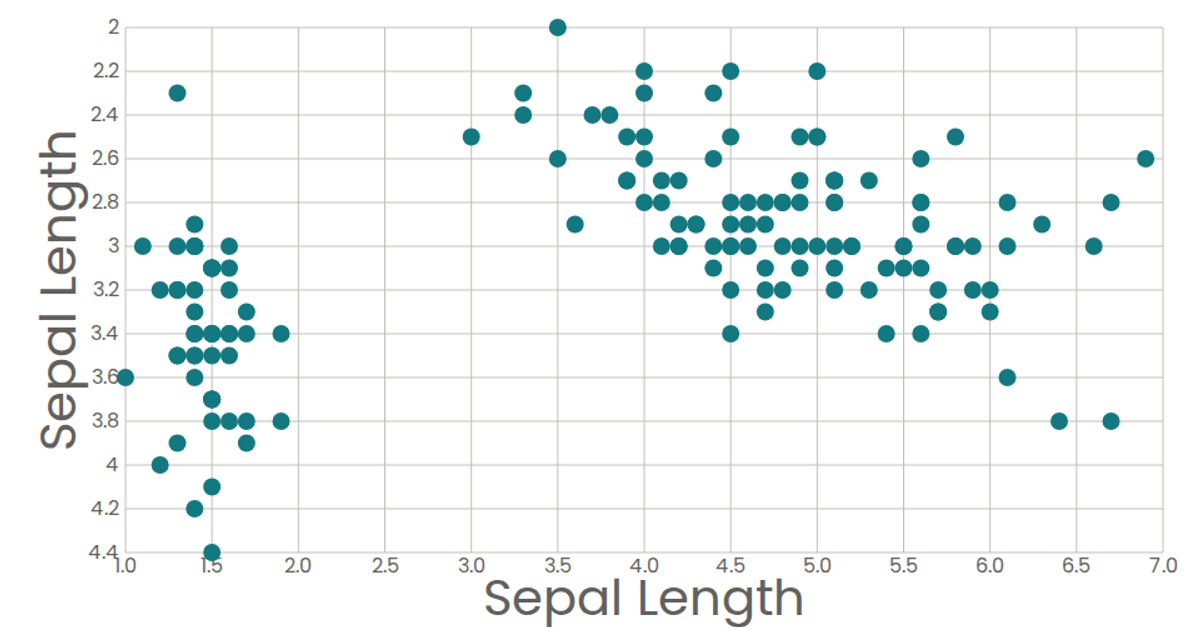
A scatter plot visualizes the Iris Dataset, plotting petal length on the x-axis against sepal width on the y-axis for individual flowers. Each circle represents a data point, with a native SVG `<title>` element providing a tooltip on hover. The visualization is built with React and D3 v5, using `csv()` to load the data, `scaleLinear()` for the axes, and custom `AxisBottom` and `AxisLeft` components to render ticks and labels.
AI-generated descriptionA scatter plot of The Iris Dataset
MIT Licensed




Comments
Sign in to join the discussion.