🌍 Public
Stylized Bar Chart
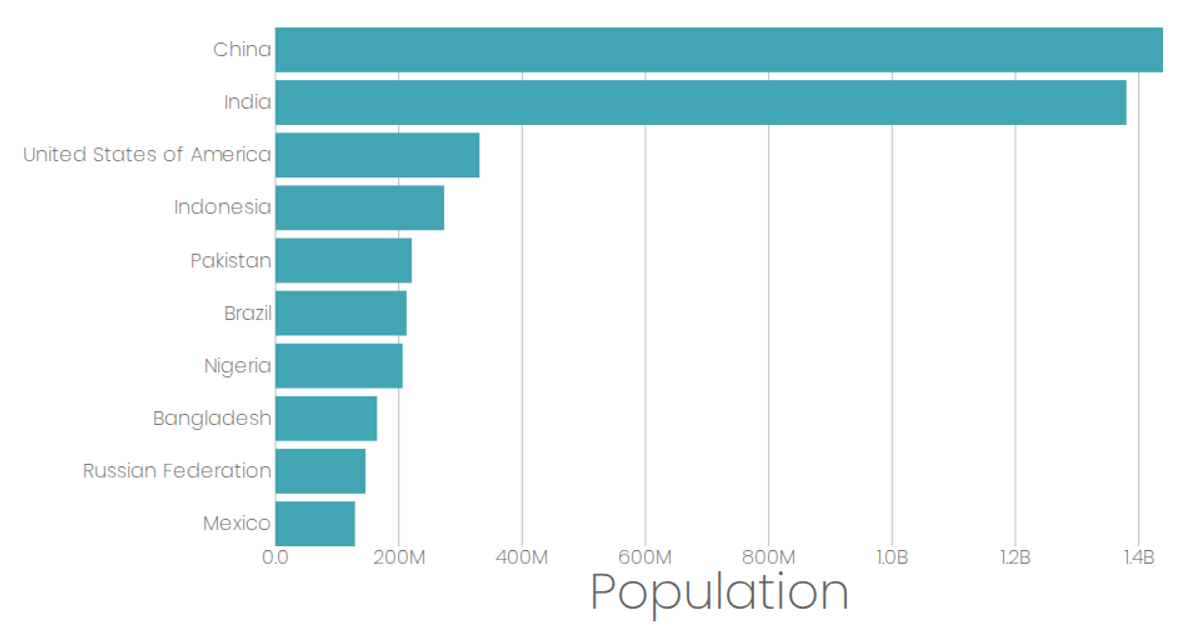
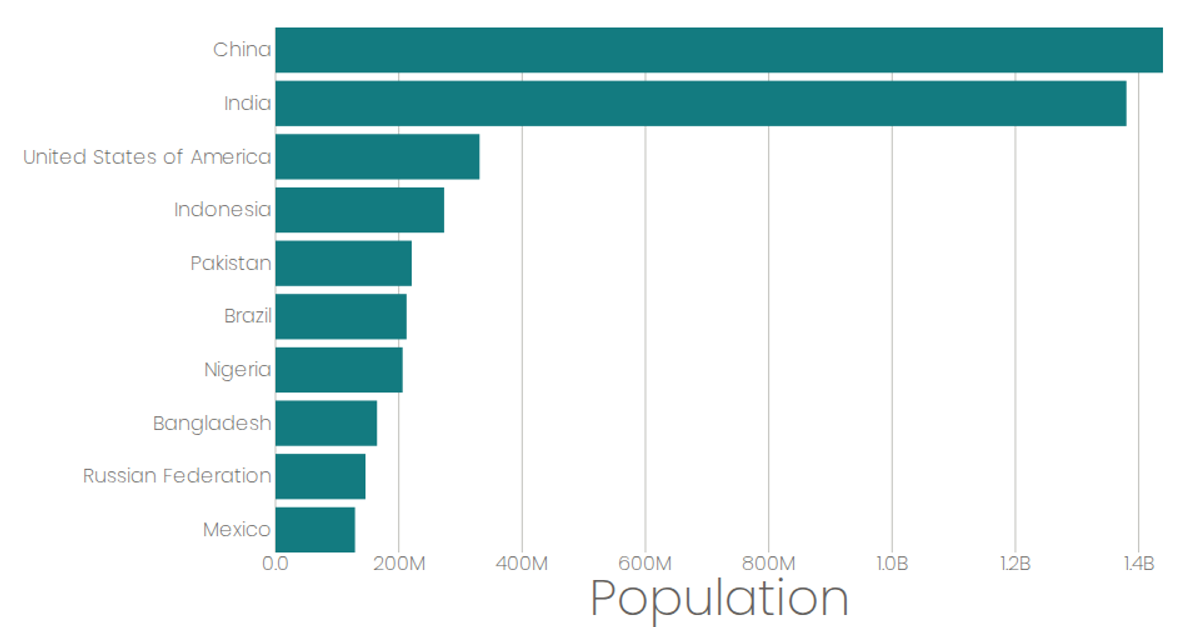
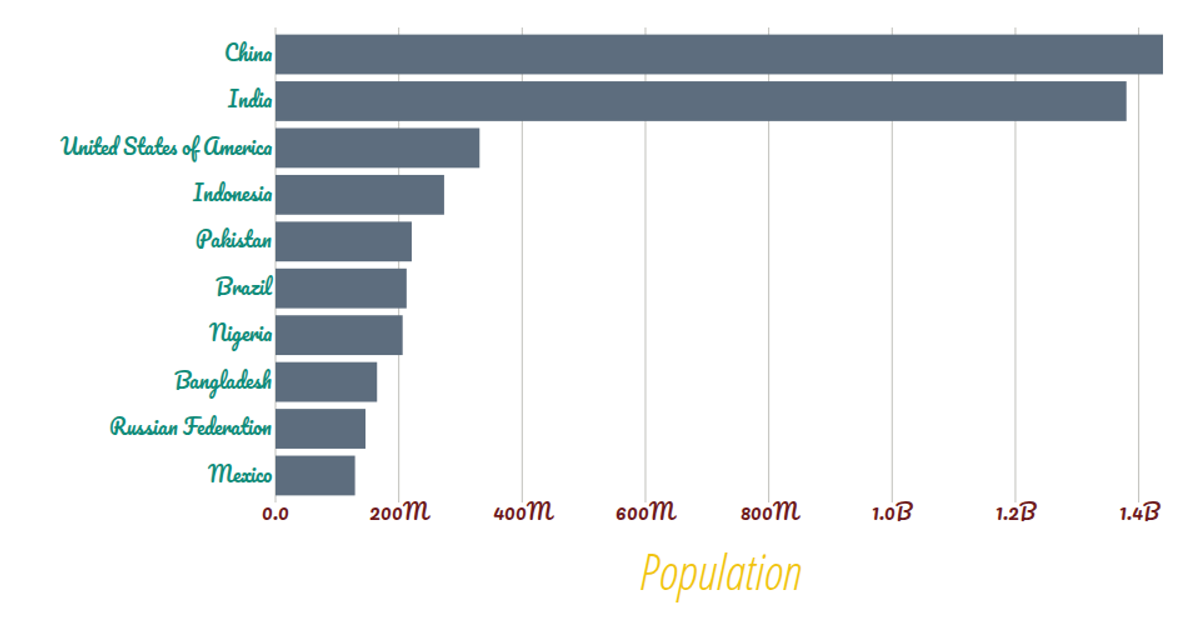
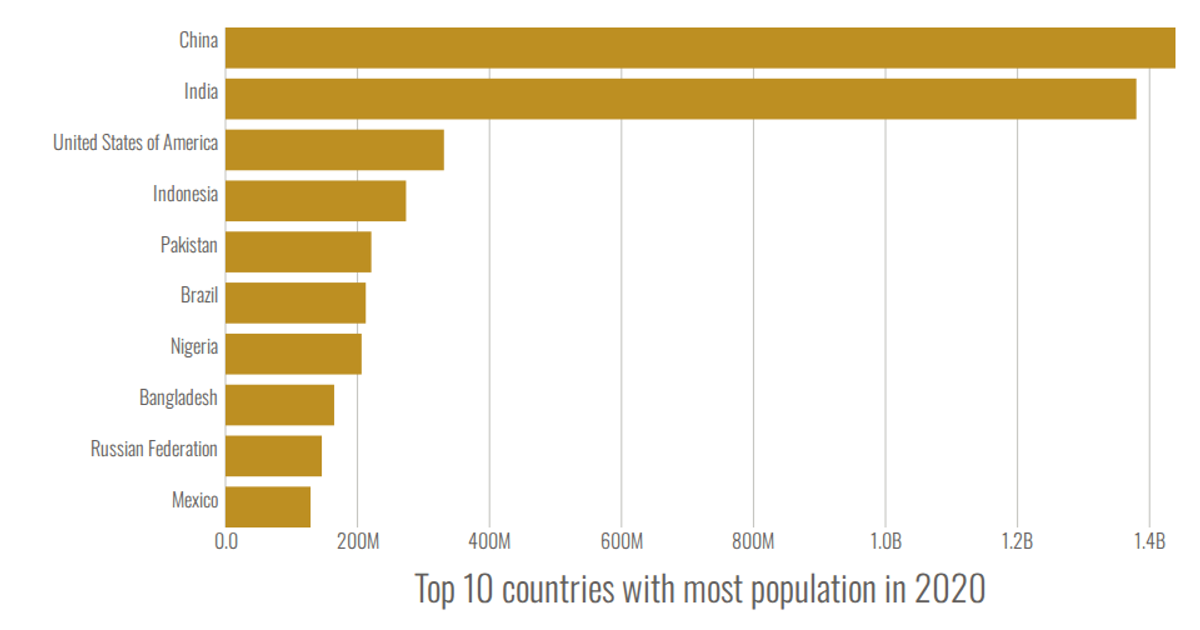
A stylized bar chart displays the top 9 countries by projected 2020 population from a UN dataset. The code uses D3's `scaleBand`, `scaleLinear`, `max`, and `format` to map values, while React components `AxisBottom`, `AxisLeft`, and `Marks` render the SVG axes and bars. Population values are formatted with SI prefixes, and the chart loads data via `csv` with a custom row parser.
AI-generated descriptionA program that loads in some data about CSS named colors using D3 utilities, and uses React state to keep track of the data.
MIT Licensed




Comments
Sign in to join the discussion.