🌍 Public
Fork of Coronavirus Deaths Over Time by Country
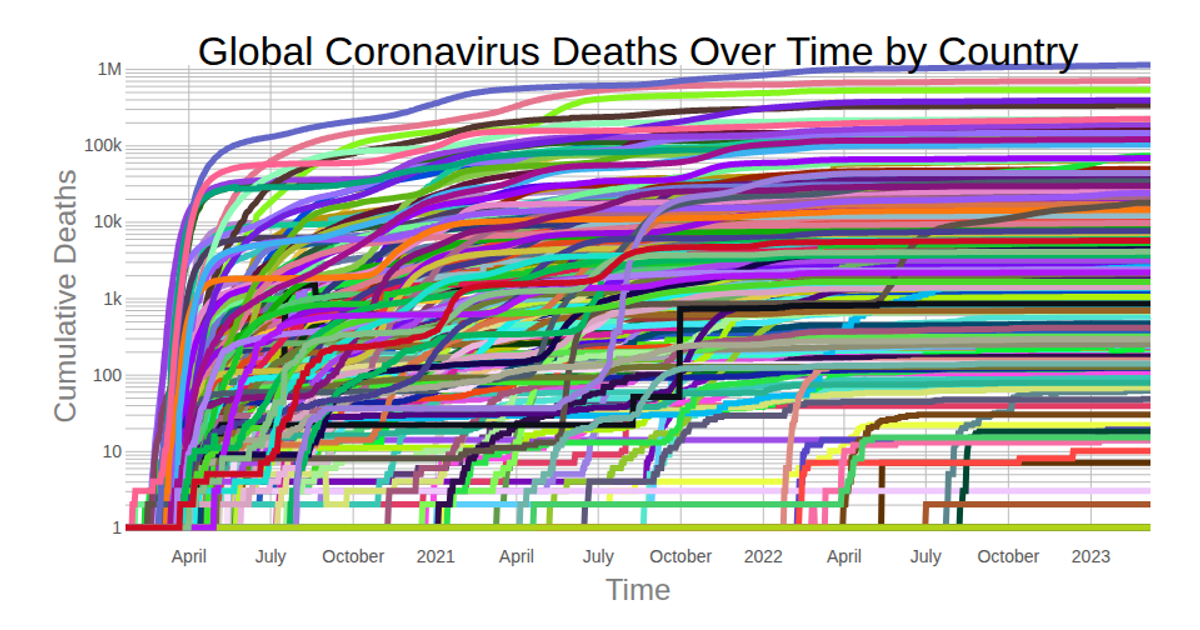
This visualization displays cumulative COVID-19 death totals over time for each country, using a logarithmic y-axis to handle wide variations in scale. The chart is built with React, using D3 v5 for data processing and SVG rendering. The `scaleLog` and `scaleTime` functions from D3 map the data, while the `line` generator creates the individual country paths. Data is sourced from the Johns Hopkins Coronavirus Dataset, fetched via `csv` and parsed with `timeParse`.
AI-generated descriptionLine chart of Coronavirus cases to date. Data from Johns Hopkins Coronavirus Dataset.
MIT Licensed



Comments
Sign in to join the discussion.