🌍 Public
ICE 7 Reusable Scatter Plot question 1
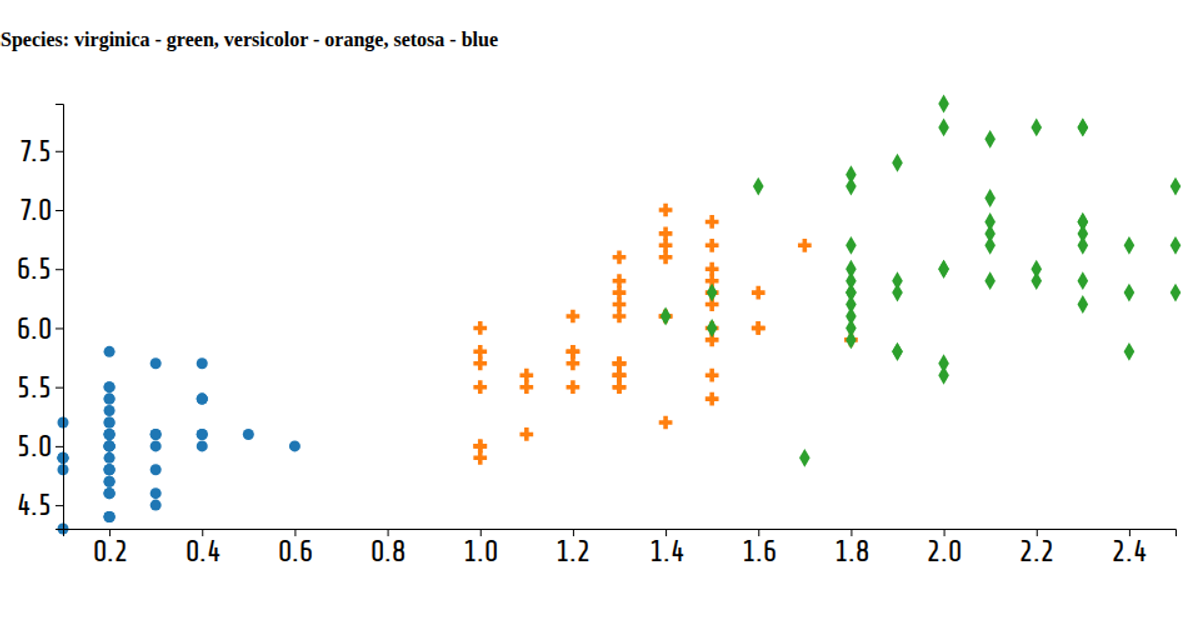
This reusable scatter plot visualizes the Iris Dataset, encoding the species of each flower with distinct shapes and colors. Built with D3 v6, it uses a custom `scatterPlot` module and a functional, object-oriented chart API. The visualization dynamically cycles through the four numeric attributes (petal width, sepal width, petal length, sepal length) on the x-axis every four seconds using `setInterval`, while the y-axis remains fixed to sepal length. SVG paths are drawn using D3's `symbol` API for shape mapping and `scaleOrdinal` for color assignment, with axes rendered via `axisLeft` and `axisBottom`.
AI-generated descriptionA reusable scatter plot inspired by Towards Reusable Charts.
Shows the Iris Dataset.
MIT Licensed







Comments
Sign in to join the discussion.