🌍 Public
Reusable scatter plot with axis labels and tooltip - TN
TToly
Last edited Dec 30, 2022
Created on Dec 30, 2022
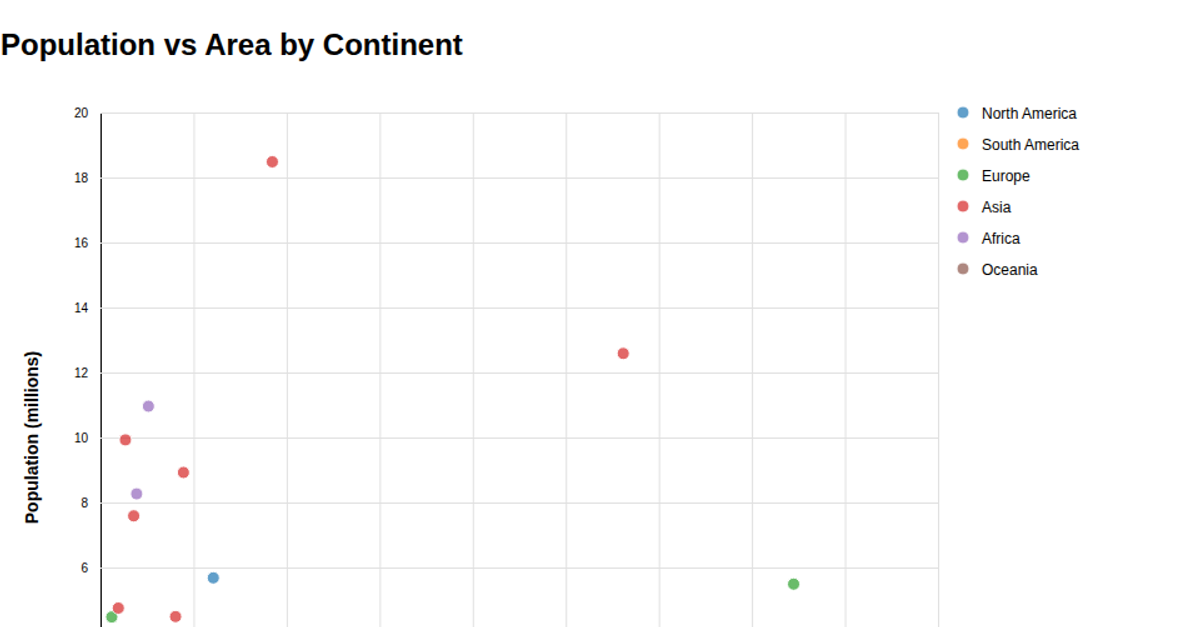
A reusable scatter plot displays EU countries by urban population percentage and fertility rate, with axis labels and hover tooltips showing country names. Built with D3 v6, it uses `scaleLinear`, `axisBottom`, `axisLeft`, and a custom `scatterPlot` function with getter-setter methods for configurability. SVG circles render the data from a CSV of 2022 EU population statistics, while tooltips appear via D3 selection events.
AI-generated descriptionReusable scatter plot with axis labels and tooltip inspired by Towards Reusable Charts.
Shows the Countries in the EU by population (2022) table of data.
MIT Licensed




Comments
Sign in to join the discussion.