🌍 Public
Harsha 1
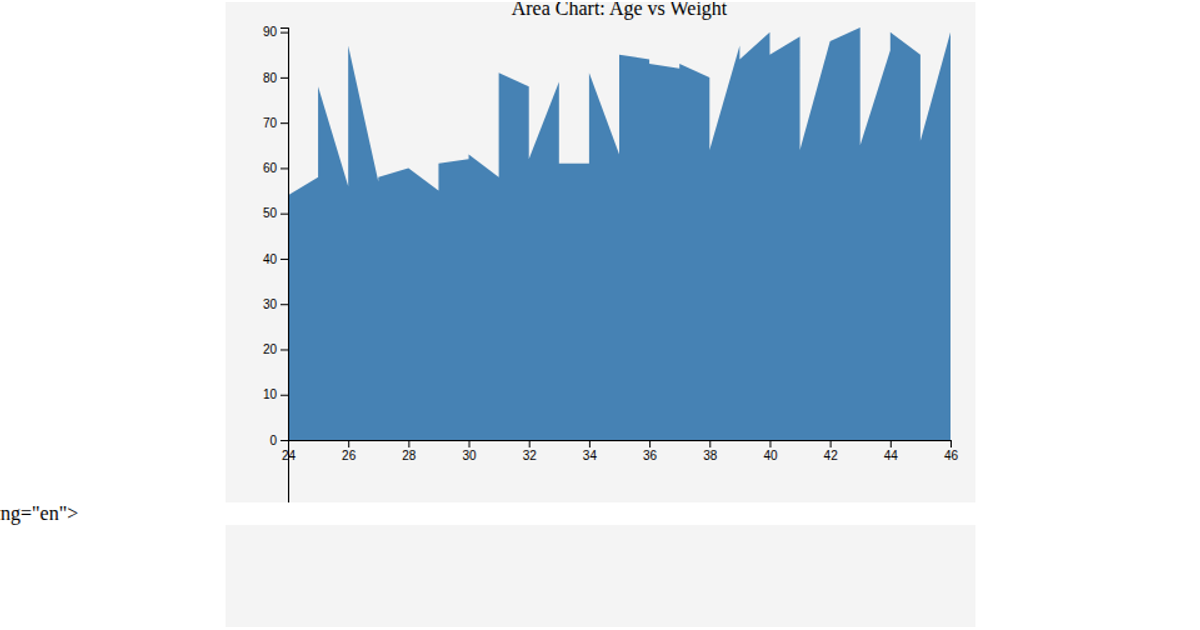
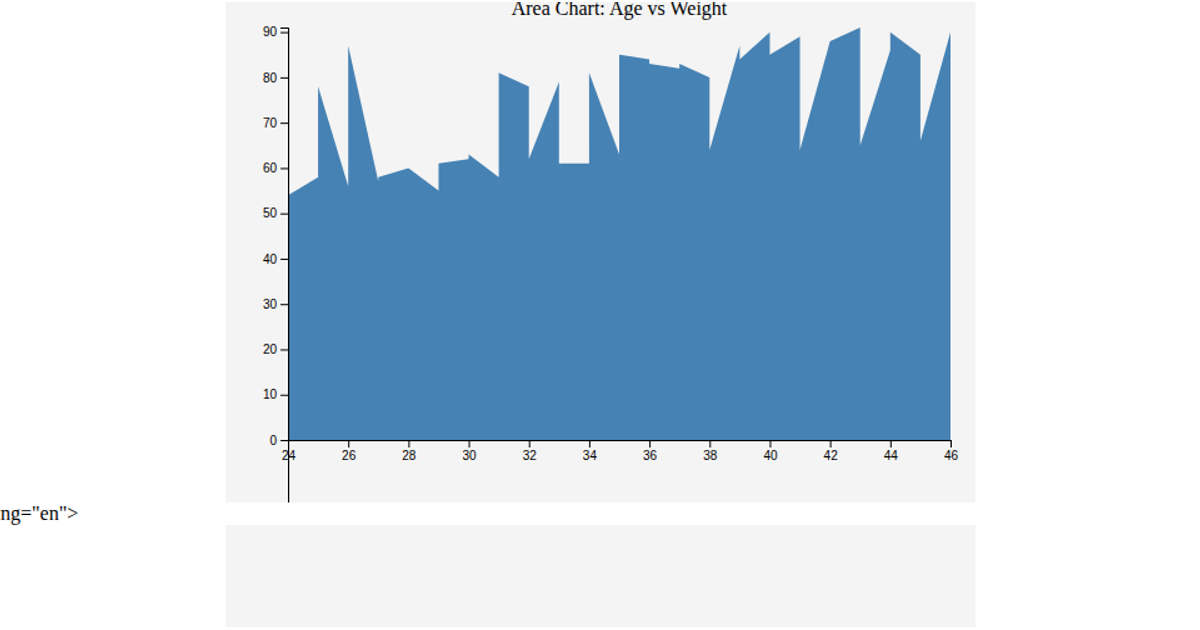
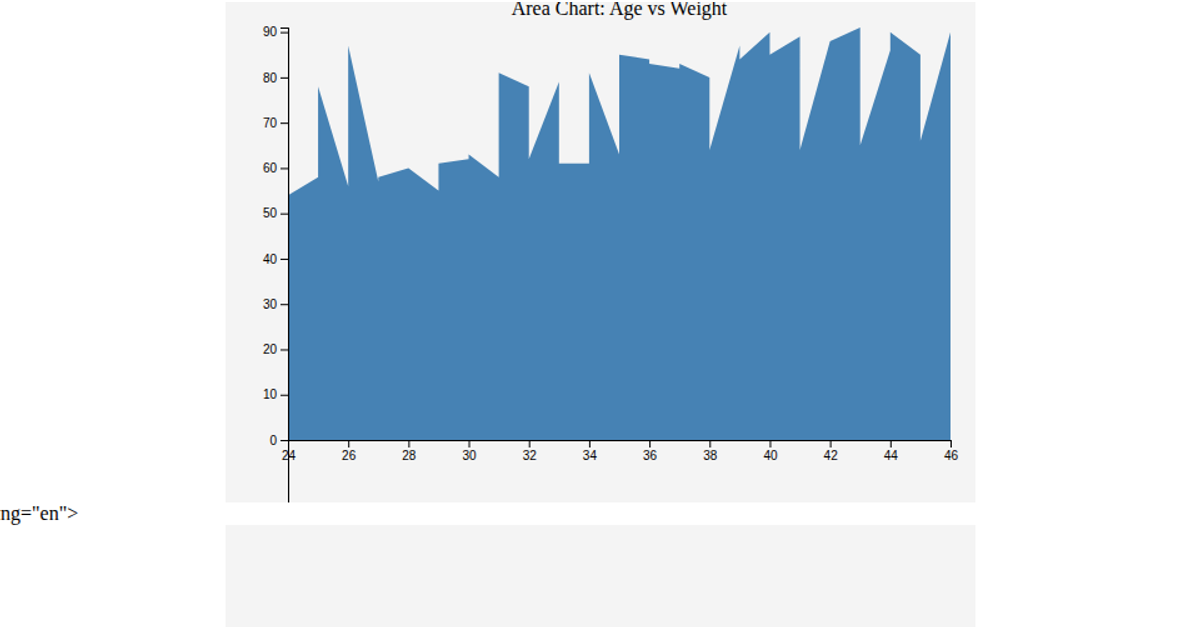
This area chart displays the change in a numeric value over time, with the area beneath the curve filled in steel blue. It loads data from a CSV file, parses dates and values, and uses d3.scaleTime and d3.scaleLinear to map the data to the SVG canvas. The visualization is built with d3.area and axes rendered using d3.axisBottom and d3.axisLeft.
AI-generated descriptionA responsive scatter plot.
MIT Licensed


Comments
Sign in to join the discussion.