This viz. is an iteration of the earlier viz., 'Viz Other than Scatter Plot'.
The changes made in this iteration are:-
- Added a title for the Viz
- Changed font of axes to Helvetica
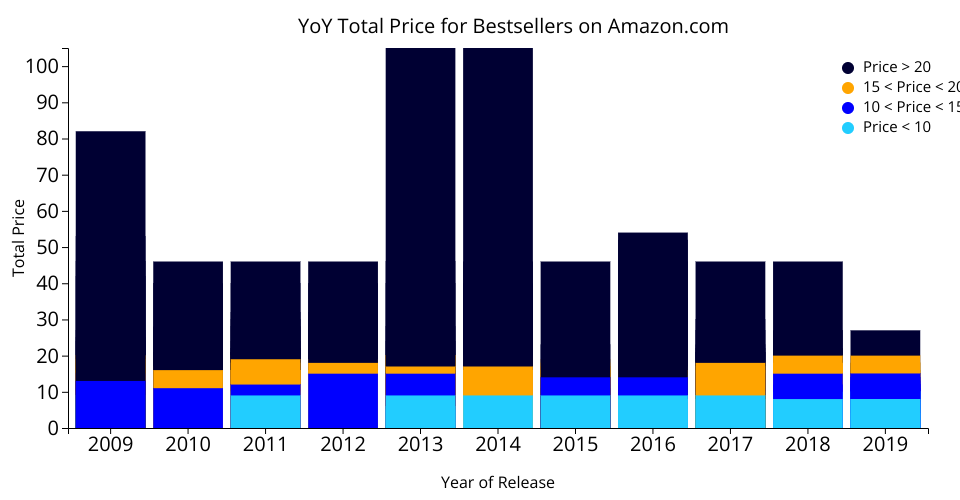
- Converted simple bar chart to a stacked chart, representing price buckets of books with different colors
- Added a legend for above colors
The above viz shows a stacked bar chart from the Amazon Best Sellers Dataset.
It shows the total price of all bestsellers in a particular year.
The colors represent the buckets of the inidividual book prices.
This graph showcases how the prices of bestseller books moves up or down year over year.
The source for this dataset is from this gist Amazon Top 50 Bestselling Books 2009 - 2019.
MIT Licensed