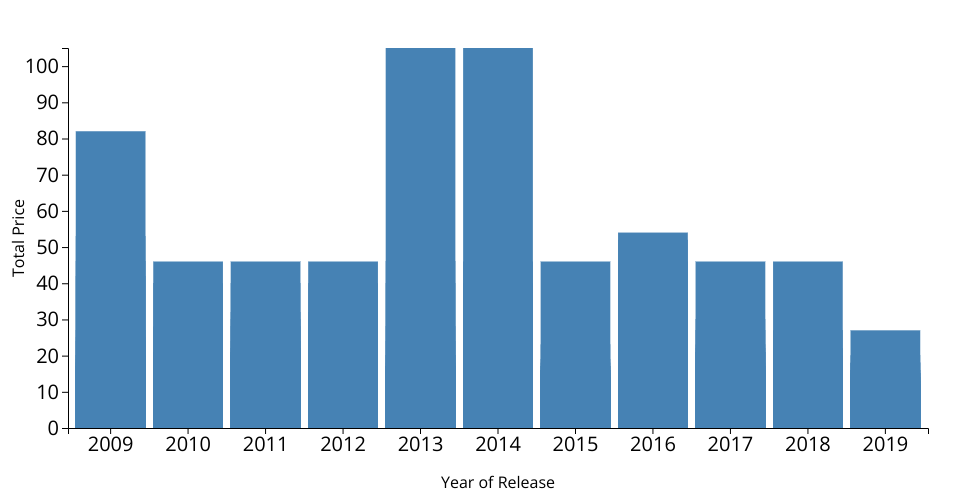
The above viz shows a bar chart from the Amazon Best Sellers Dataset.
It shows the total price of all bestsellers in a partcilcuar year.
This graph showcases how the prices of bestseller books moves up or down year over year.
The source for this dataset is from this gist Amazon Top 50 Bestselling Books 2009 - 2019.
MIT Licensed