🌍 Public
Fork of ICE 7question 3 Line Chart sh
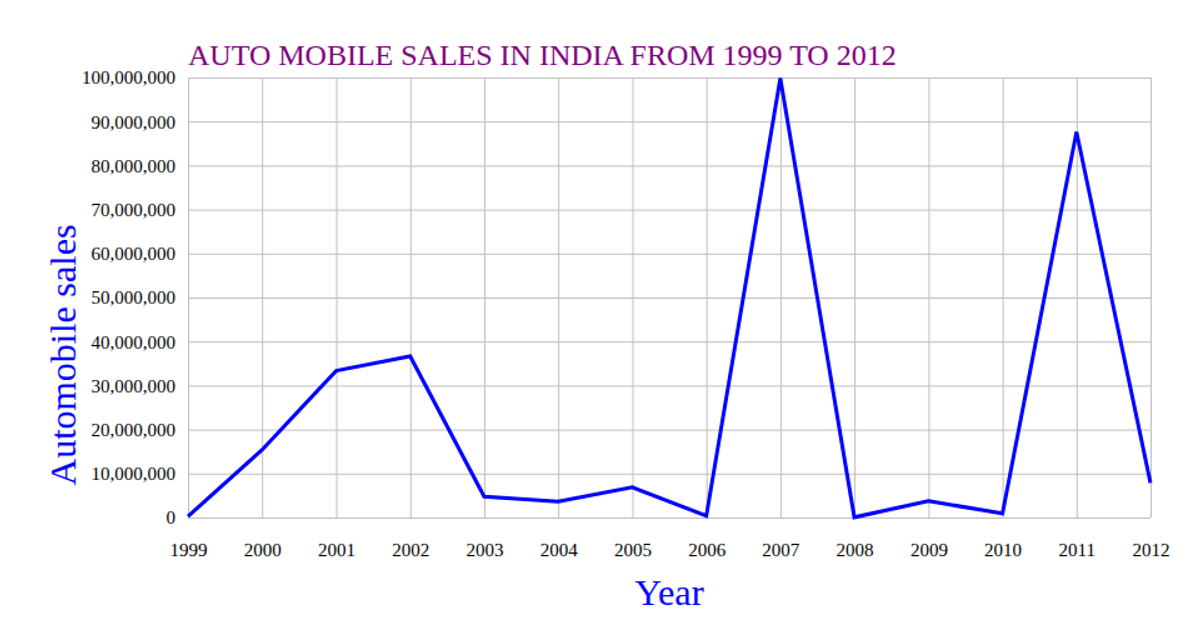
This line chart displays automobile sales in India from 1999 to 2012, with years on the x-axis and sales figures on the y-axis. The code loads CSV data from a GitHub gist using d3.csv, then renders an SVG using d3.scaleTime, d3.scaleLinear, d3.axisBottom, d3.axisLeft, and d3.line. The chart includes gridlines, axis labels, and a blue line path, with styling handled through an external CSS file.
AI-generated descriptionMIT Licensed




Comments
Sign in to join the discussion.