🌍 Public
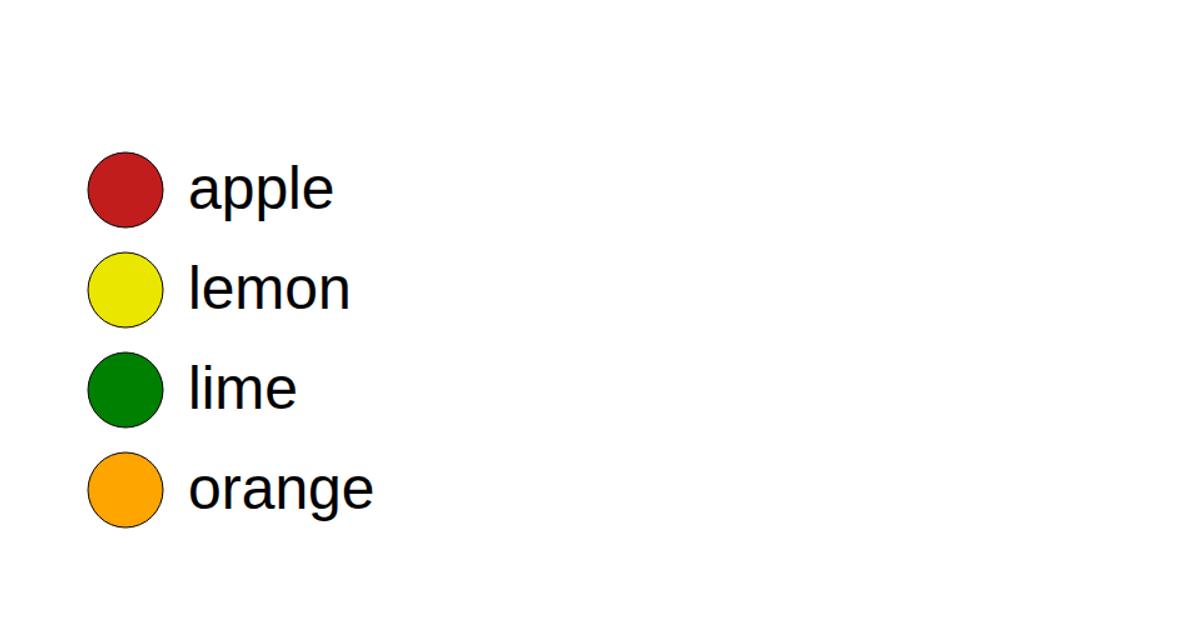
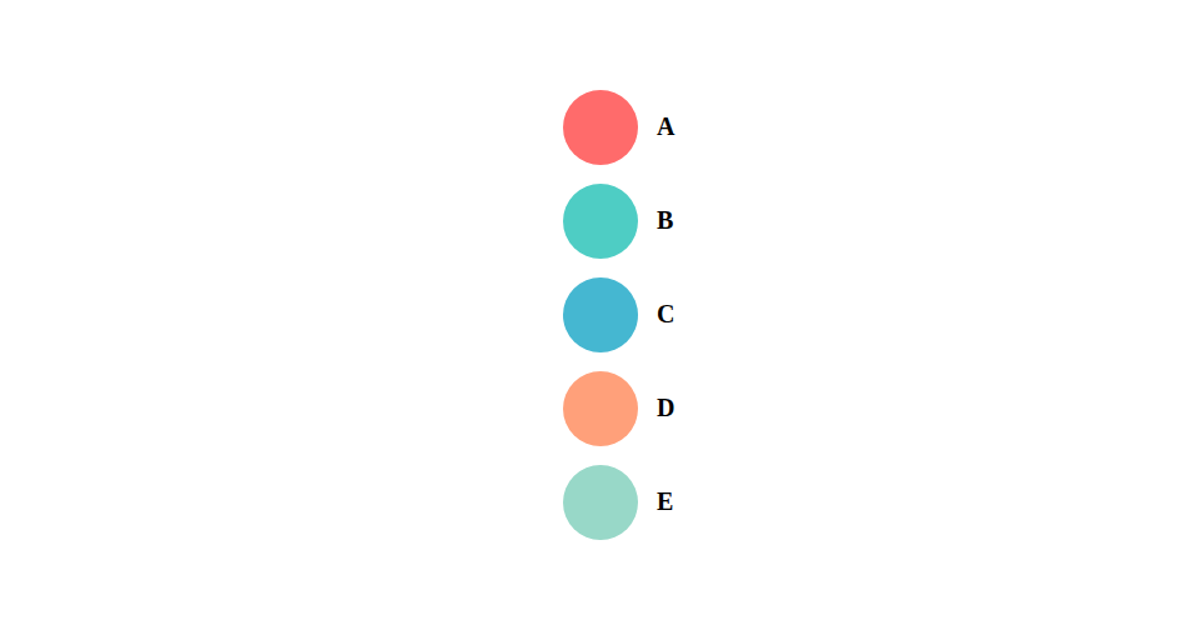
Color Legend
This example displays a single red circle on an SVG canvas, titled “Color Legend.” The visualization loads student marks from a local CSV file using D3’s `csv` method and logs the parsed data to the console. The SVG element is selected via D3’s `select`, and the circle is appended with fixed attributes for radius, fill color, and coordinates. Built with React and D3 v5, it renders as a static SVG without interactive features.
AI-generated descriptionA bare minimum HTML page.
See also React Starter.
MIT Licensed




Comments
Sign in to join the discussion.