🌍 Public
First Vega-Lite API Ex
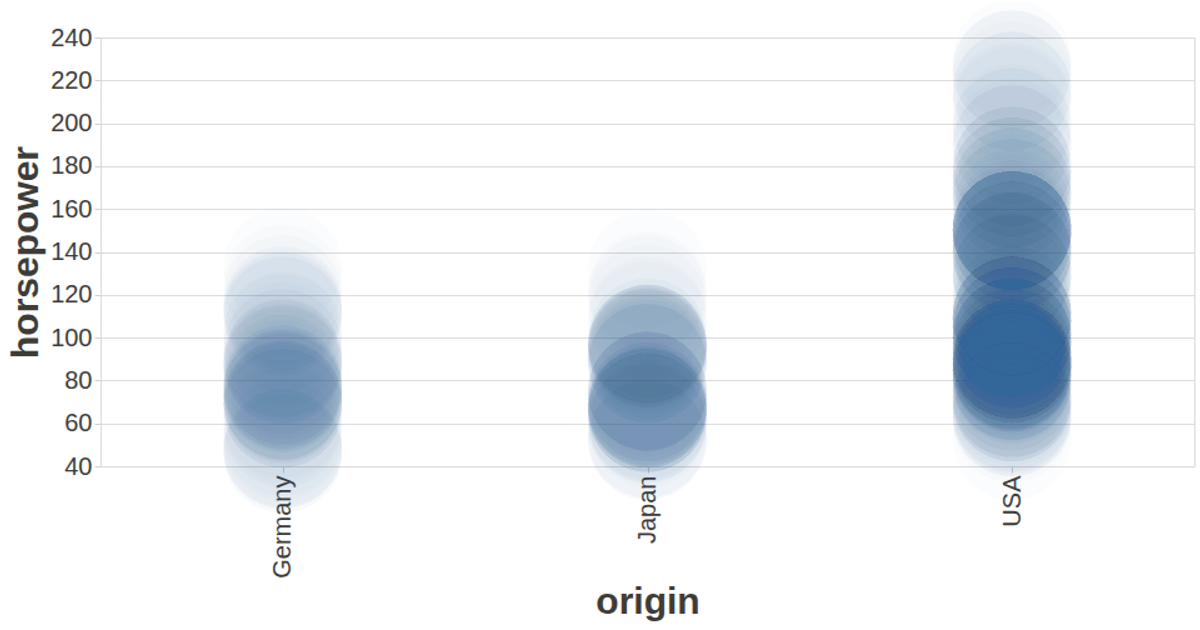
This example shows a bar chart of automobile counts by country of origin, using data from the UCI Auto MPG dataset loaded via d3.csv. The visualization is built programmatically with the Vega-Lite API, defining a single bar mark with a tooltip encoding for car names. It renders as SVG through Vega, with custom axis and label styling configured in a separate config file. The chart automatically fits the browser viewport dimensions.
AI-generated descriptionA visualization constructed using the vega-lite-api.
The data shown here comes from the UCI Machine Learning Repository: Auto MPG Data Set, via Gist: Scatter Plot with Menus.
MIT Licensed


Comments
Sign in to join the discussion.