Resources
Contact
Pricing
🇺🇸
EN
Log in
Open Editor
Revision History
Export Image
Share
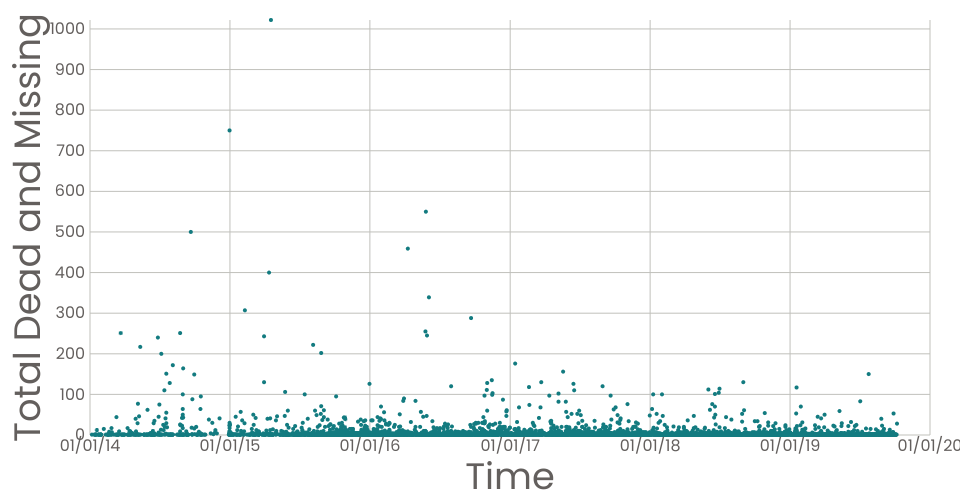
Missing Migrants Scatter Plot - Episode 38
1
Fork
0
Likes
roc286
0 views in last 90 days
Last edited Mar 15, 2022
Created on Mar 15, 2022
Forked from
Working with Time
uses
v2 runtime
A scatter plot of the
Missing Migrants Dataset
.
Each point in the plot represents a single event.
MIT Licensed