0 views in last 90 days
roc286
@roc286
So much work, So little time....
Public vizzes

React Performance Optimization - Episode 45

Multiple Views w/ Brushing - Episode 44
Multiple Views Clean Up - Episode 43
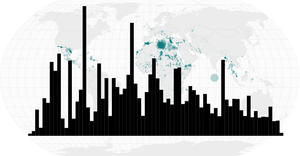
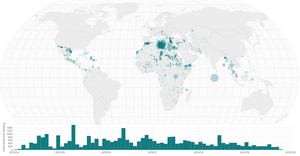
Missing Migrants Multiple Views - Episode 41
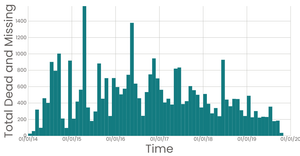
Missing Migrants Aggregation by Month - Episode 39
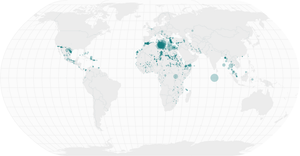
Missing Migrants on a Map - Episode 40
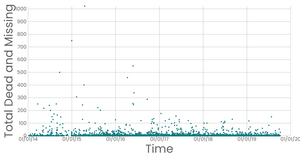
Missing Migrants Scatter Plot - Episode 38
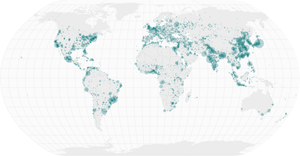
Sized Points on a Map - Episode 37
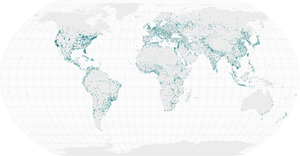
Points on a Map - Episode 36

Interactive Color Legend - Lecture 35

Scatter Plot with Color Legend - Lecture 34

Scatter Plot with Color - Lecture 33

Polished Scatter Plot with Menus
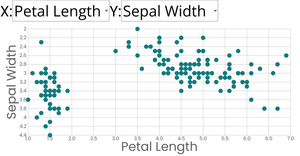
Scatter Plot with Menus

React Starter
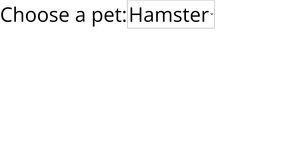
Menus with React - with HTML Native Select

World Map
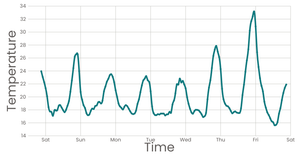
Working with Time-Line Chart
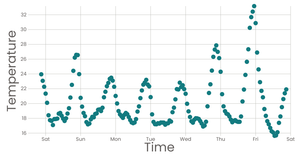
Working with Time
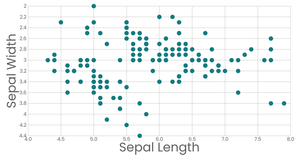
Stylized Scatter Plot
Stylized Bar Chart with React & D3
Axes (Bar Chart) with React & D3 - Refactored

Axes (Bar Chart) with React & D3

Margin Convention (Bar Chart)

Fork of Axes with React & D3

Rendering Barchart with React & D3

Rendering Data with React - Pie Chart
Loading Data with React & D3

Mouse Follower

Loading and Parsing CSV Data