This chart was made using Stylized Scatter Plot as a base and modified based on CS573 Week 5 videos. New data was then ported from the International Cabinets dataset - reduced to only include country, female ratio, military ratio, retention and government.
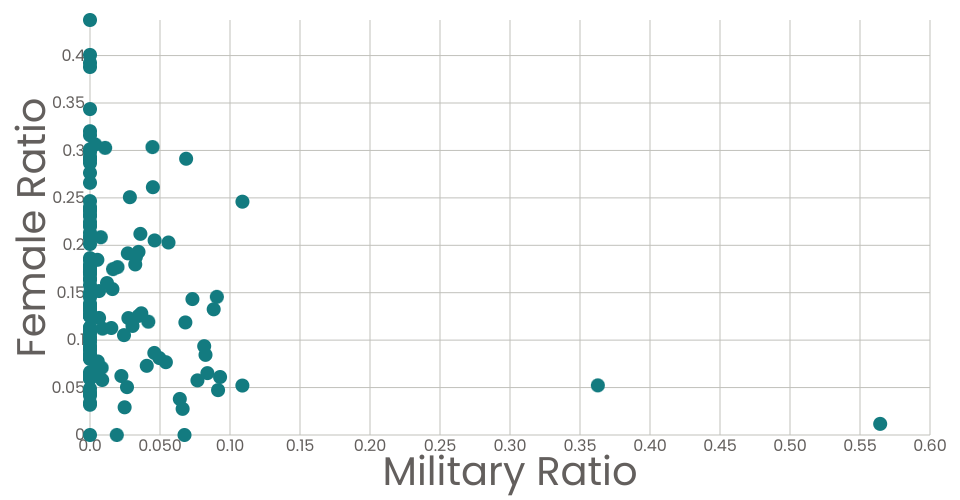
The chart plots the female ratio against the military ratio of governmental cabinets. The retention rate is taken as the 11-year average for each country for the years 2006-2016. Countries that experienced regime/system change during the 11-year window are excluded from the dataset.
The chart was designed to investigate the question "How does the ratio of females in cabinets relate to the ratio of military personal in cabinets?" The chart shows that the highest level of military involvement typically occurs with the lowest level of female involvement, and vice versa.
The data is a subset WhoGov's International Cabinets dataset. The dataset contains information about more than 50,000 cabinet members from 177 countries, spanning July 1966 - July 2016. There is a separate entry for each cabinet member, from each country, for each year. Each entry contains information such as party affiliation, gender, age and military affiliation. This chart was made using this chart as a base and modified based on CS573 Week 5 videos.