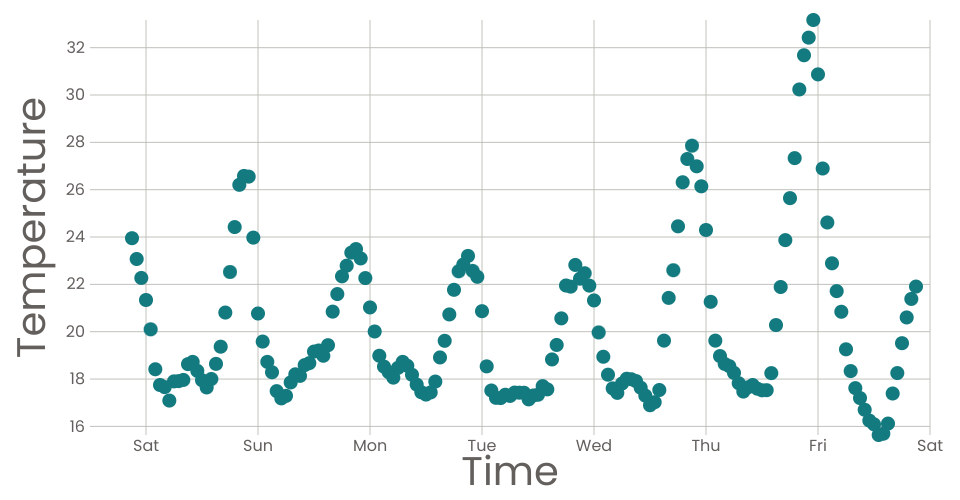
A scatter plot of 1-week of temperature data taken from this gist.
This chart was made using this chart as a base and modified based on CS573 Week 5 videos.
MIT Licensed
A scatter plot of 1-week of temperature data taken from this gist.
This chart was made using this chart as a base and modified based on CS573 Week 5 videos.