🌍 Public
Gráfico de Área com interações
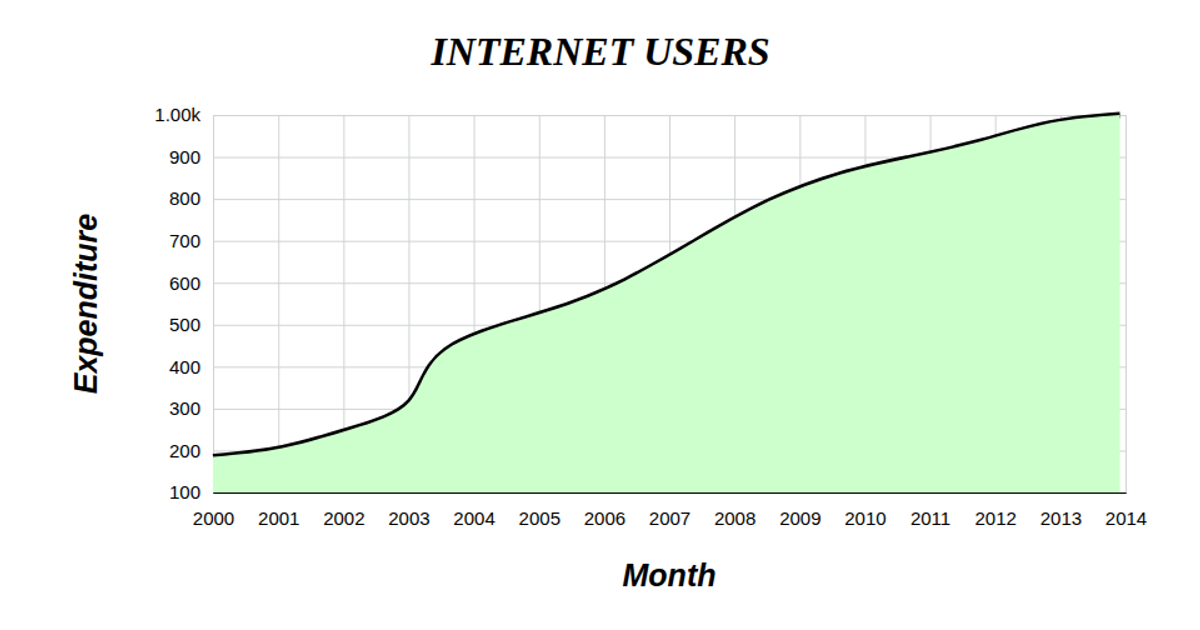
This interactive area chart visualizes monthly income and expenses over time, with the y-axis labeled in Portuguese as "Temperatura" (temperature) and the x-axis representing time. The visualization renders an SVG using React and D3 v5, incorporating `scaleTime` and `scaleLinear` for axis scaling, `extent` for domain calculation, and `line` with `curveNatural` for the smoothed data path. While axis ticks and grid lines are drawn, the chart currently shows only the line, not an area fill or data point circles, despite the title suggesting interactivity. The data comes from a static array loaded via a custom `useData` hook.
AI-generated descriptionMIT Licensed


Comments
Sign in to join the discussion.