A visualization constructed using the vega-lite-api.
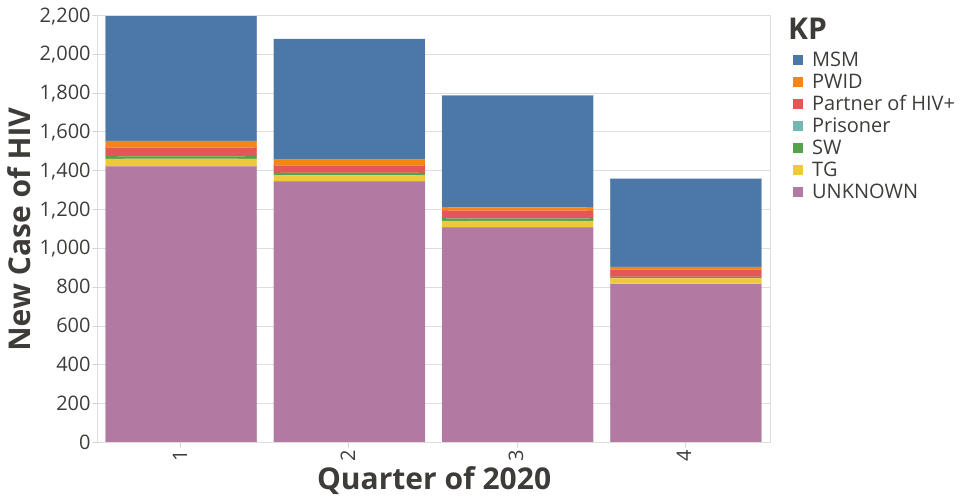
The visualization comes from Bangkok Smart Monitoring System. It's designed to emphasize the number of "new HIV cases" each quarter in Bangkok, aggregating by the key population (e.g. MSM, TG). Each stacked bar represented the total number of HIV new cases.
MIT Licensed