🌍 Public
Fork of D3 Starter
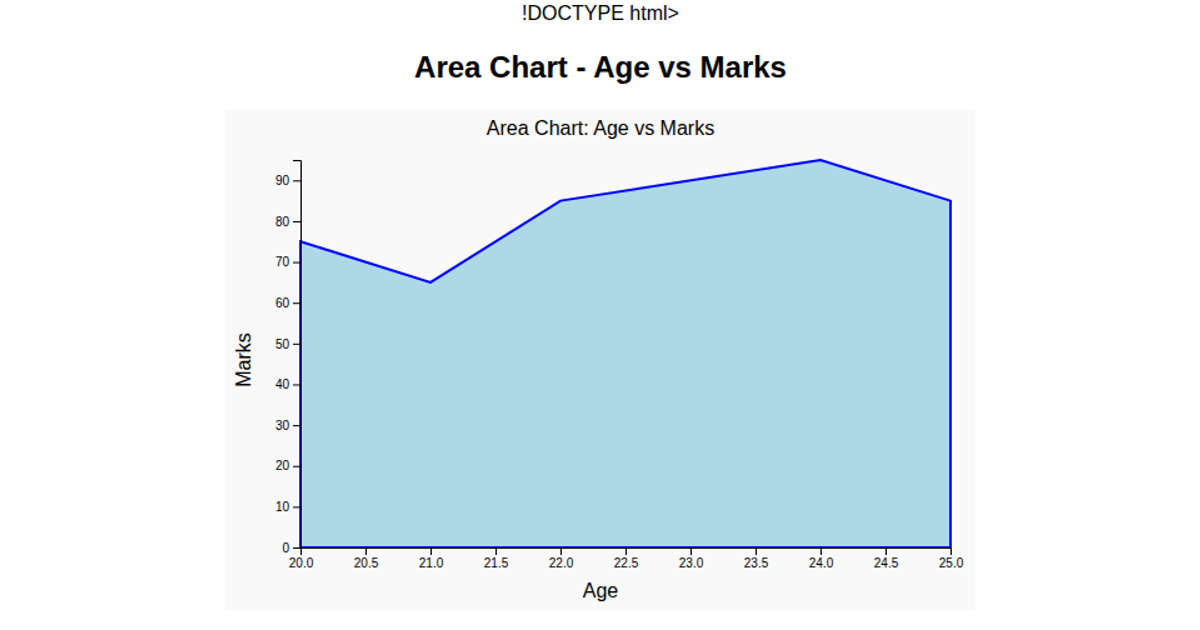
This example displays a scatter plot comparing age and weight for six data points, with labeled axes and a title. It uses the Google Charts loader and its `google.visualization.ScatterChart` API to render the chart inside a `chart_div` element, while also loading D3 v7 via a script tag. The code defines the dataset inline with `google.visualization.arrayToDataTable` and sets axis ranges and legend options before drawing. Although the page includes D3, the visible functionality relies entirely on Google Charts, not D3 methods.
AI-generated descriptionMIT Licensed





Comments
Sign in to join the discussion.