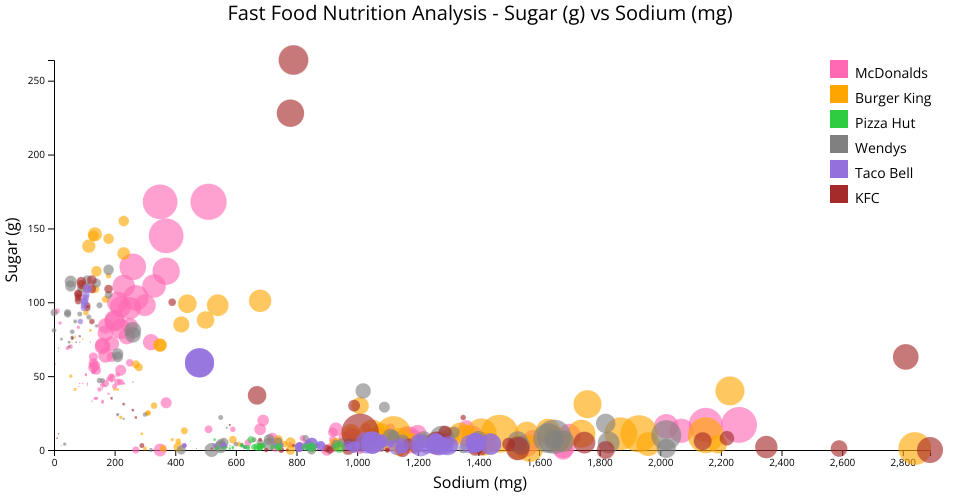
CS573 Final Project Chart showcasing a responsive Sugar vs Sodium levels scatter plot for menu items belonging to six of the most popular fast food restaurants. Bubble size is derived by the calories of the menu item.
Bubbles are color-coded by restaurant name as follows:
- McDonald's (Pink)
- Wendy's (Gray)
- KFC (Brown)
- Pizza Hut (Green)
- Burger King (Orange)
- Taco Bell (Purple)
Interactive Features include:
- Tooltip data view
- Interactive color legend
Dataset: https://www.kaggle.com/datasets/joebeachcapital/fast-food
MIT Licensed