🌍 Public
Fork of Vega-Lite API Template
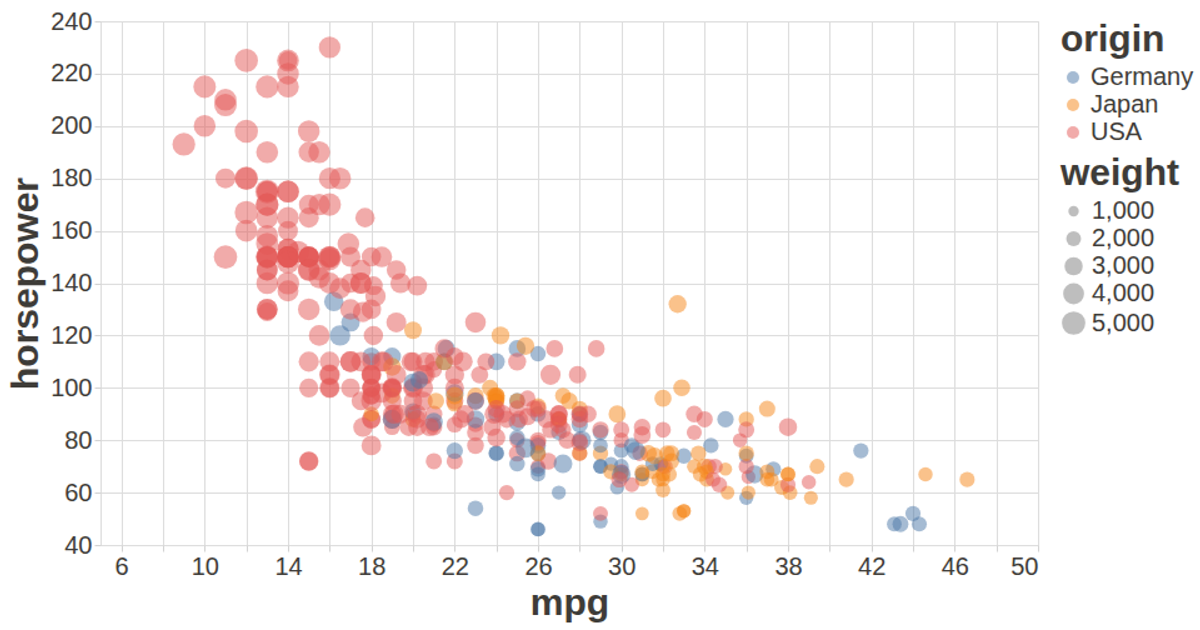
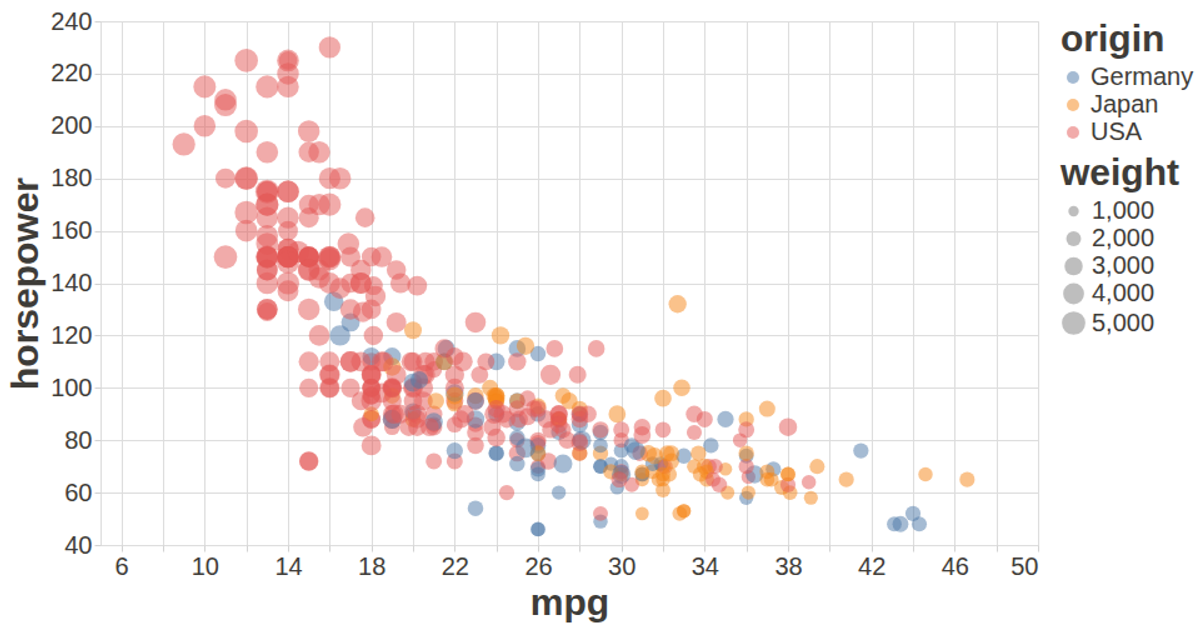
This scatter plot visualizes the relationship between miles per gallon, horsepower, and weight for cars from the UCI Auto MPG dataset, with color encoding for the country of origin and tooltips showing car names. Built with the Vega-Lite API, it registers Vega and Vega-Lite through `vl.register`, loads CSV data via D3’s `d3.csv`, and renders an interactive SVG chart. The visualization uses custom configuration for styled axes and labels, with automatic sizing to fit the browser window.
AI-generated descriptionA visualization constructed using the vega-lite-api.
The data shown here comes from the UCI Machine Learning Repository: Auto MPG Data Set, via Gist: Scatter Plot with Menus.
MIT Licensed




Comments
Sign in to join the discussion.