Napoleon's Russian Campaign Visualization
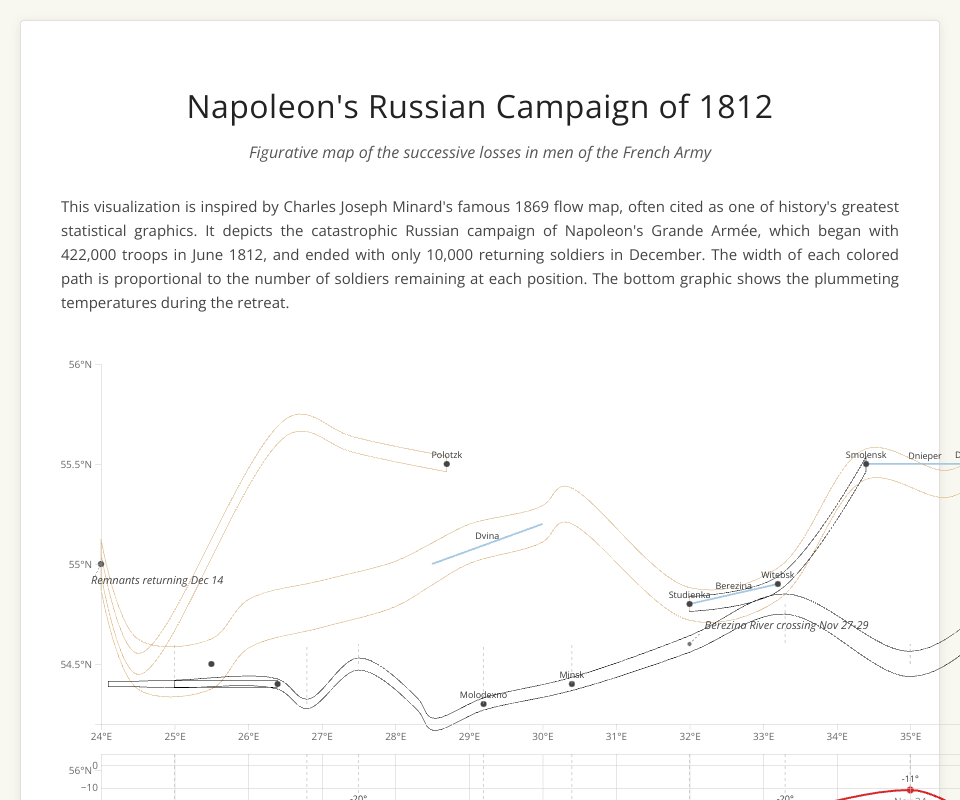
This is an interactive data visualization of Napoleon's disastrous 1812 Russian campaign, inspired by Charles Joseph Minard's famous flow map from 1869.
The visualization shows:
- The size of the French army (represented by the width of the path)
- The route of advance and retreat
- The temperature during the retreat
- Key locations and events during the campaign
This project uses D3.js to create an interactive version of Minard's classic visualization.
MIT Licensed