Napoleon's Russian Campaign Visualization
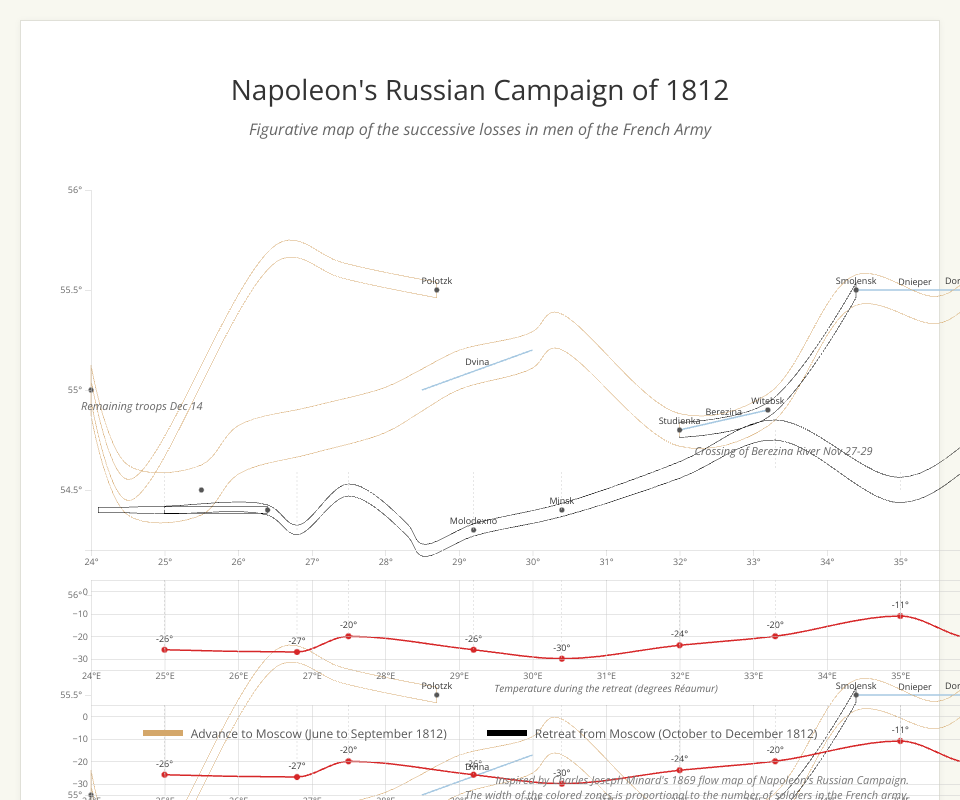
This project recreates Charles Minard's famous 1869 flow map that depicts Napoleon's disastrous Russian campaign of 1812. The visualization shows both the diminishing size of Napoleon's army (the width of the path) and the dropping temperatures during the retreat (in the lower graph).
Minard's original visualization is considered a masterpiece of statistical graphics, combining six different data variables in a single two-dimensional image:
- The size of the army (represented by the width of the path)
- The location of the army (latitude and longitude)
- Direction of movement (advancing or retreating)
- Temperature during the retreat
- River crossings along the march
- Key dates and locations
This implementation uses D3.js to recreate this visualization in an interactive format.
MIT Licensed