Ottoman Empire Population Visualization
This visualization presents the relative population distribution of different ethnic groups within the Ottoman Empire, featuring:
- Bar chart visualization
- Ancient papyrus styling
- Interactive hover effects
- Antique color scheme
- Responsive design
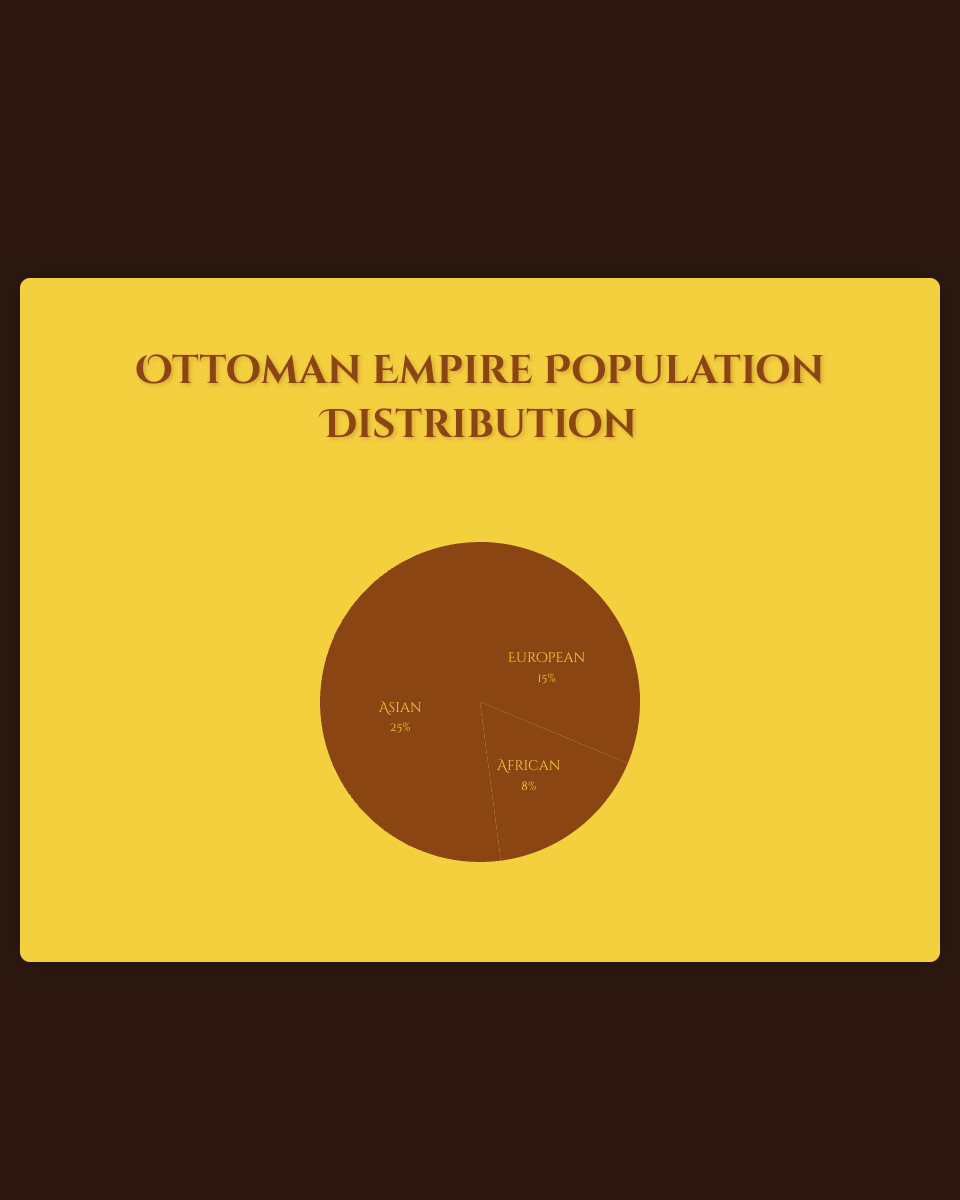
The visualization displays the relative populations of:
- European peoples
- African peoples
- Asian peoples
Features:
- Papyrus texture background
- Ancient scroll unroll animation
- Hover effects on bars
- Classical styling with Cinzel Decorative font
- D3.js-powered visualization
- Responsive design
The visualization uses HTML, CSS, and JavaScript with D3.js to create an immersive historical data experience.
MIT Licensed