Scotland Trade Data Visualization (1781)
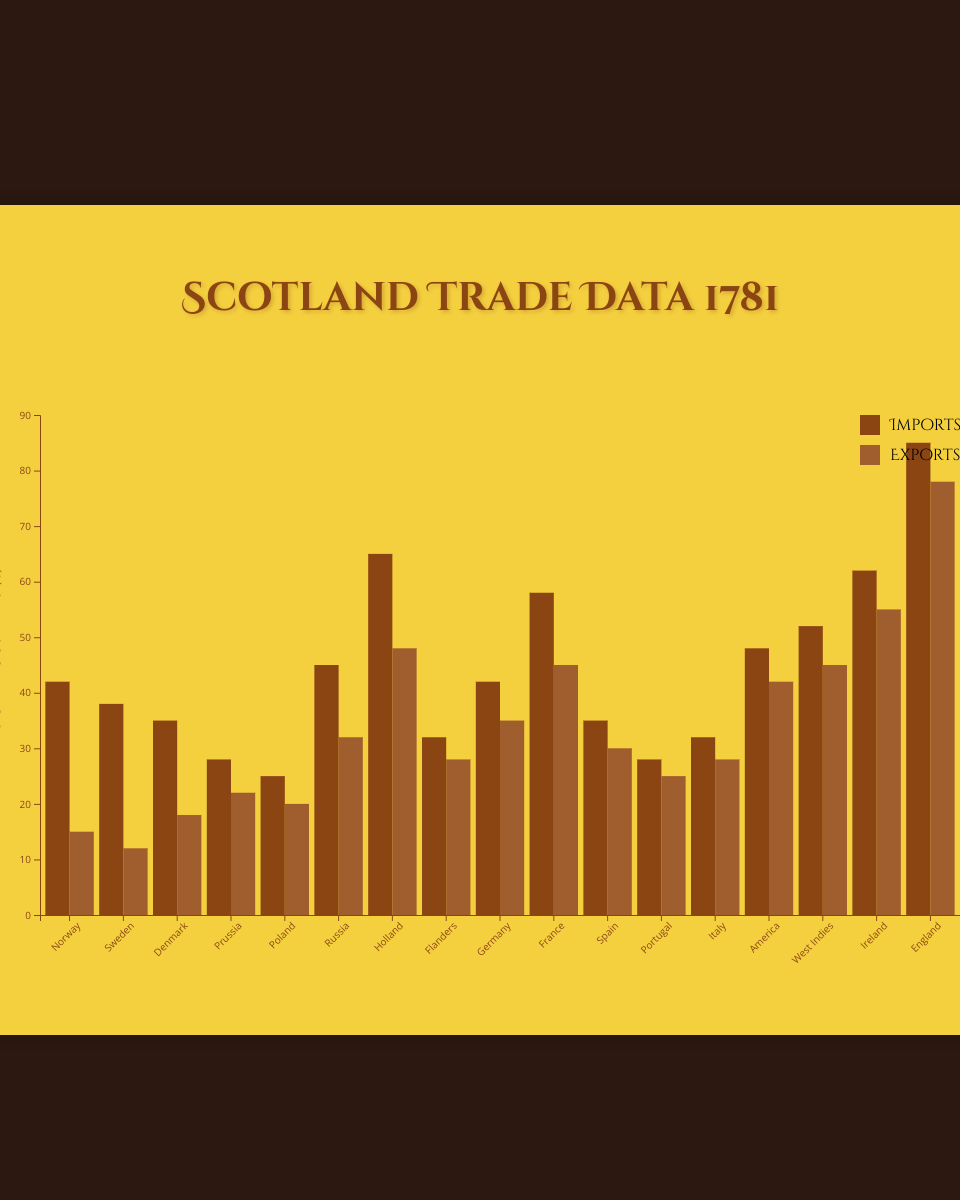
This visualization presents the import and export data for Scotland in 1781, featuring:
- Double bar chart visualization showing imports and exports
- 17 trading partners represented
- Values in tens of thousands of pounds
- Ancient papyrus styling
- Interactive hover effects
- Antique color scheme
- Responsive design
Features:
- Papyrus texture background
- Ancient scroll unroll animation
- Hover effects on bars
- Classical styling with Cinzel Decorative font
- D3.js-powered visualization
- Clear distinction between import and export values
The visualization uses HTML, CSS, and JavaScript with D3.js to create an immersive historical data experience inspired by William Playfair's work.
MIT Licensed