Middle East Timeline Visualization
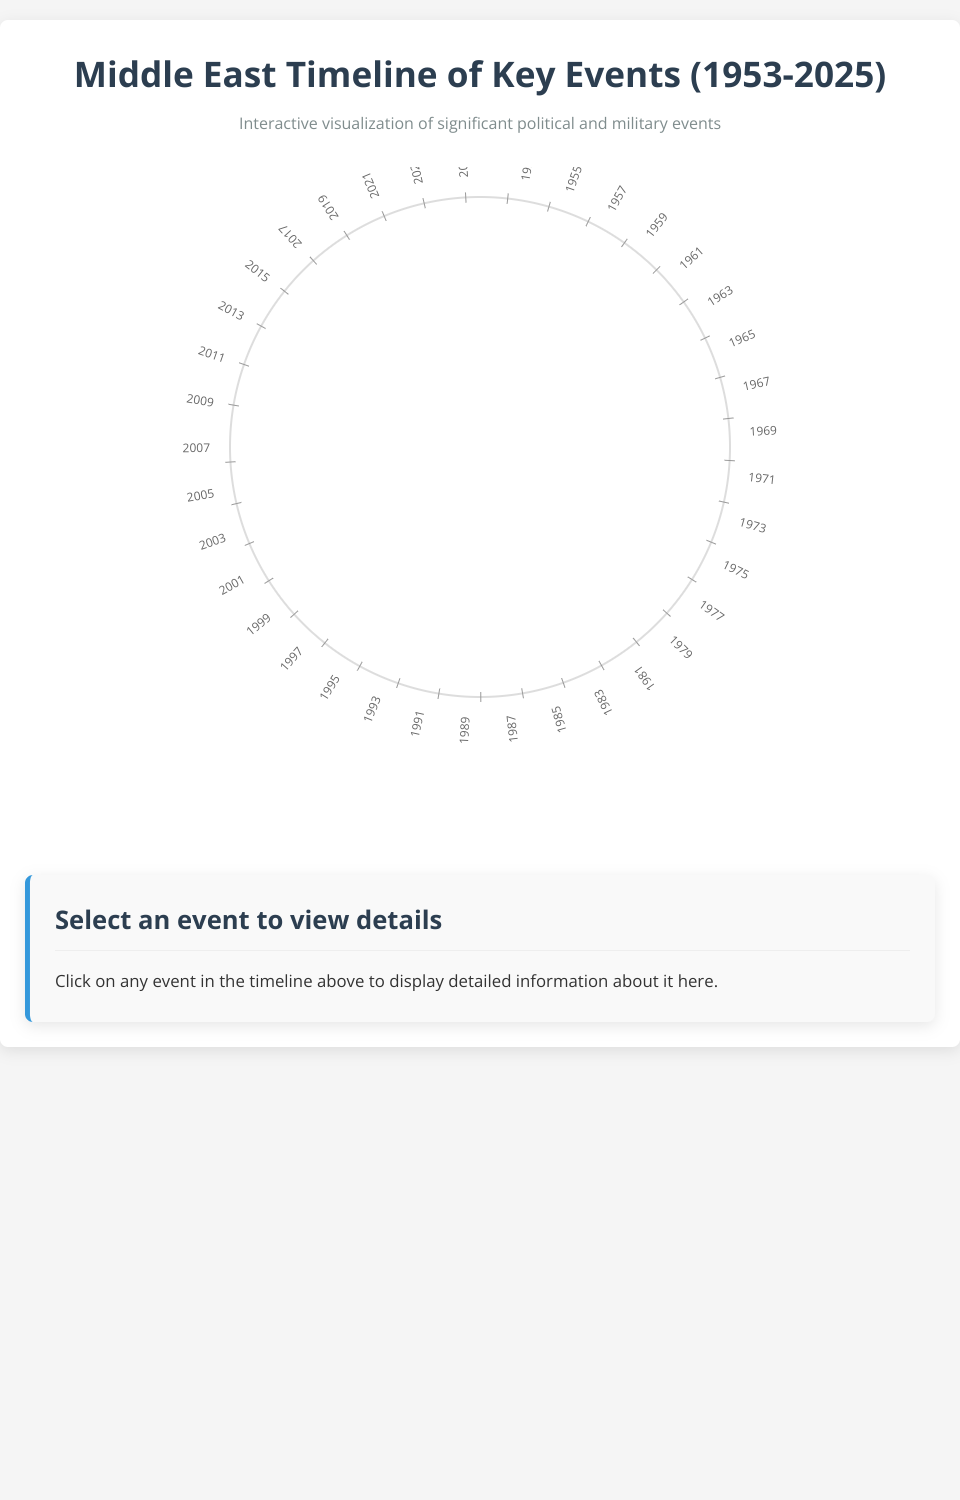
An interactive visualization showing key historical and recent events in the Middle East from 1953 to 2025.
Features
- Interactive circular timeline visualization using D3.js
- Filter events by category
- Detailed information panel for selected events
- Responsive design that works on mobile and desktop
- Color-coded events by category
- Smooth animations and transitions
Usage
- View the timeline to see events plotted chronologically
- Filter events by category using the buttons above the timeline
- Hover over events to see a quick summary
- Click on an event to view detailed information
- Timeline automatically adjusts to screen size
Technical Details
The visualization is built with:
- HTML, CSS, and JavaScript
- D3.js for data visualization
- ES6 modules for code organization
MIT Licensed