Middle East Timeline Visualization
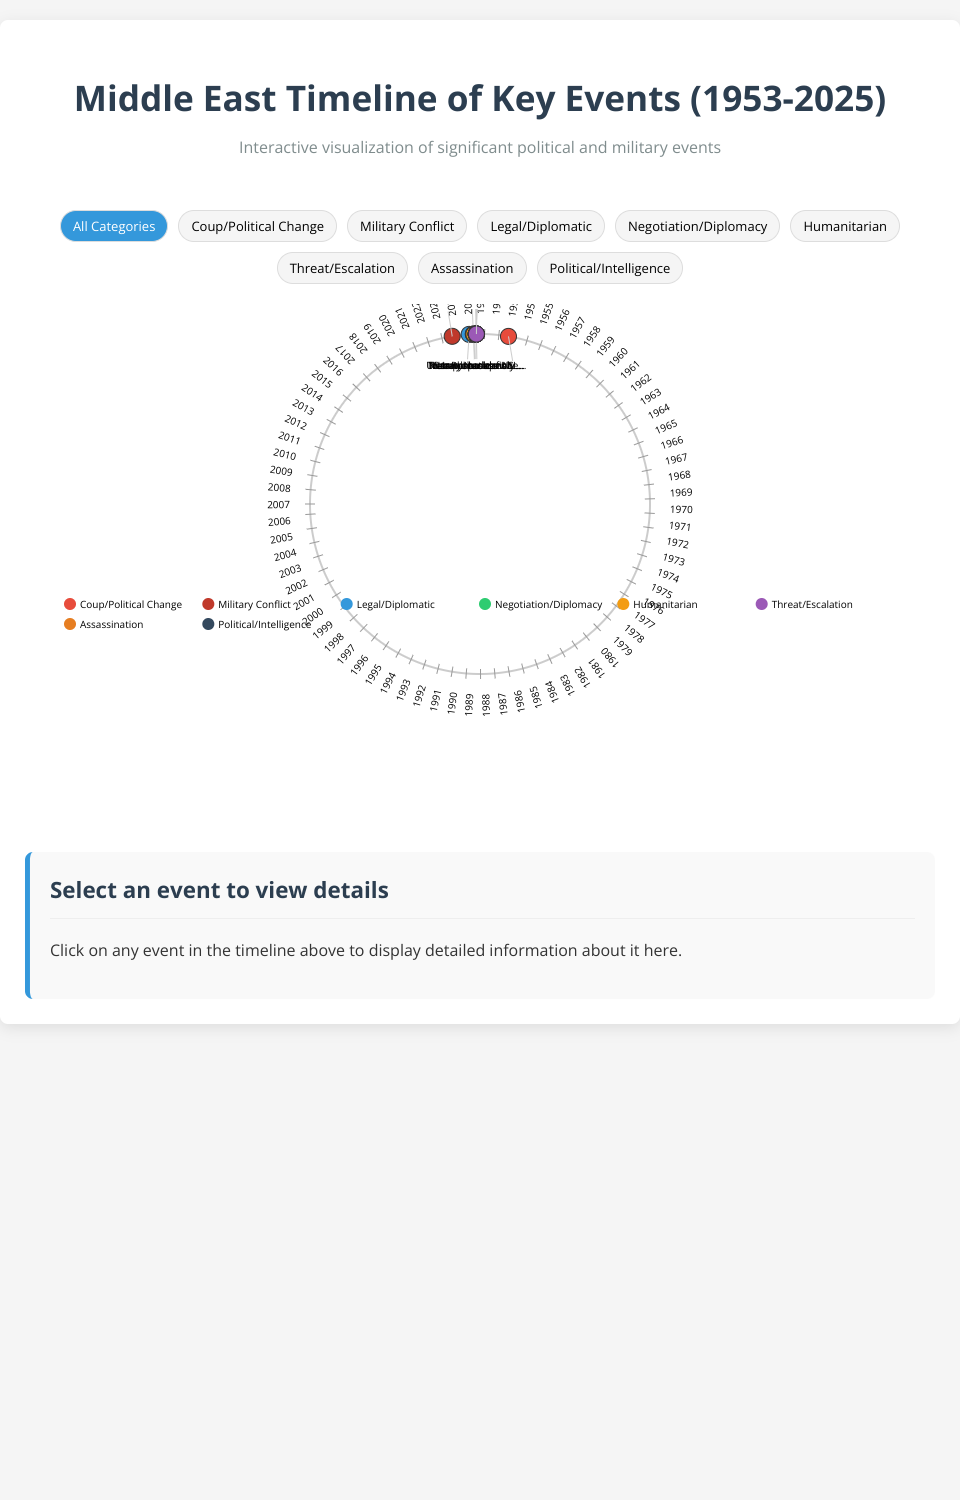
An interactive circular timeline visualization showing key events in the Middle East from 1953 to 2025.
Features
- Circular timeline visualization for better overview of temporal relationships
- Interactive event markers with detailed information on click
- Filtering by event categories
- Responsive design that adapts to different screen sizes
- Visual highlighting of selected events
- Tooltip information on hover
Implementation
This visualization is built using:
- D3.js for data visualization
- JavaScript modules for organization
- CSS for styling
Usage
Click on any event marker to see detailed information about that event. Use the category filters to focus on specific types of events.
MIT Licensed