Napoleon's Russian Campaign Visualization
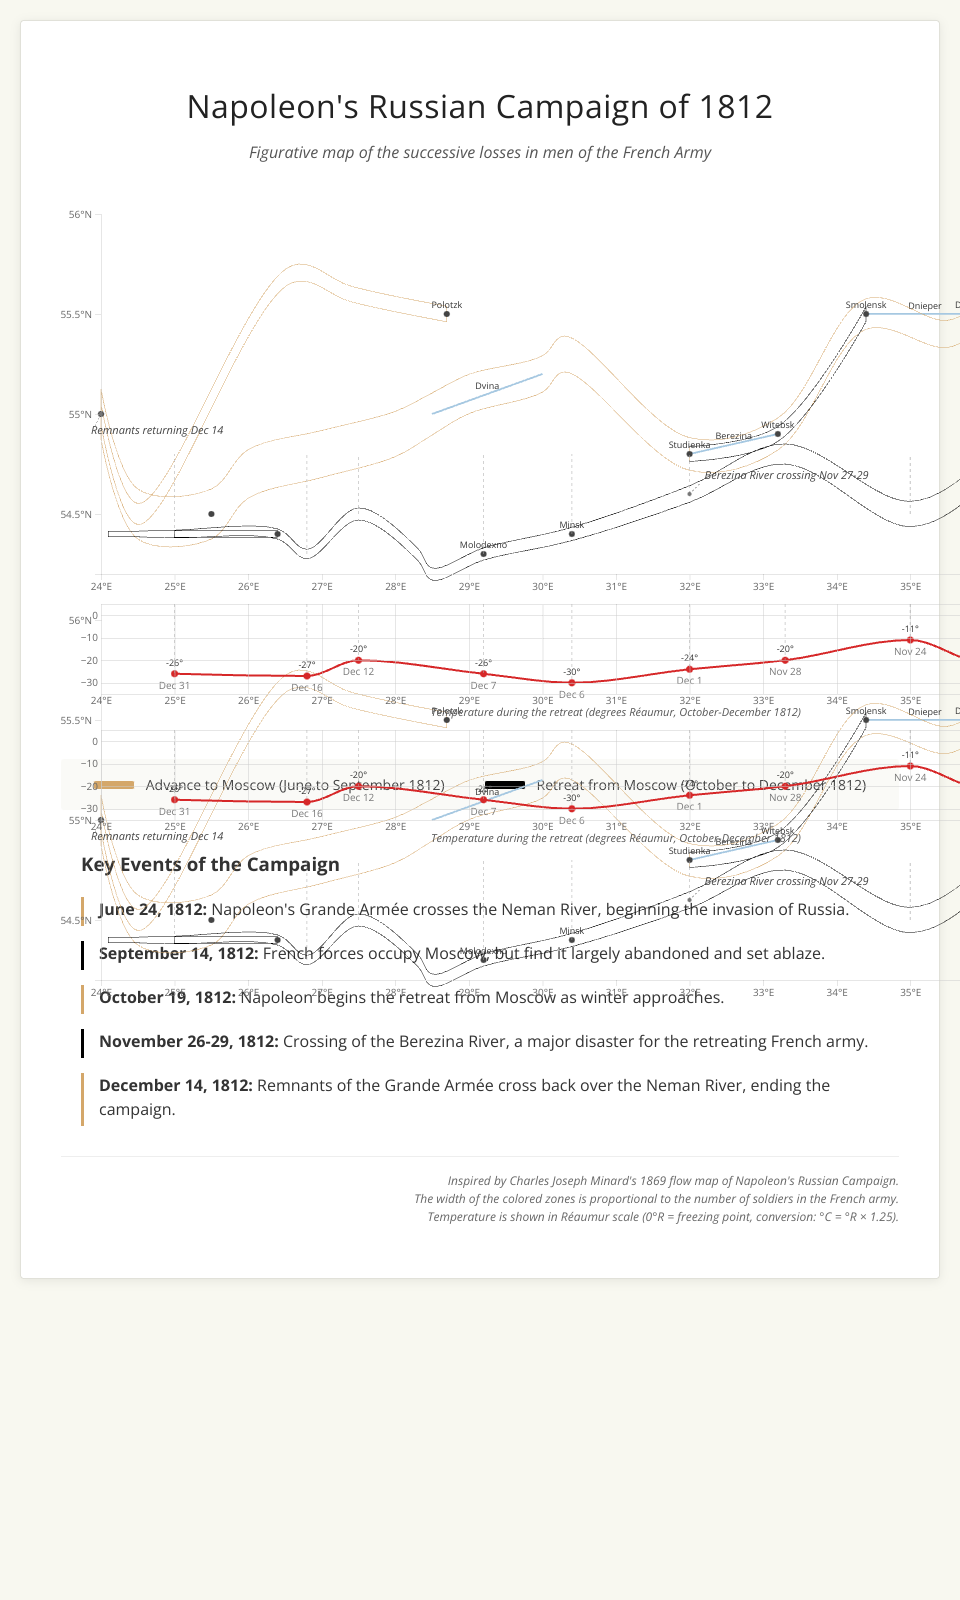
An interactive D3.js visualization inspired by Charles Joseph Minard's famous 1869 flow map showing Napoleon's disastrous Russian campaign of 1812.
Features
- Visual representation of troop movements and losses
- Temperature chart showing the harsh winter conditions during the retreat
- Interactive tooltips with detailed information
- Responsive design for different screen sizes
Technologies Used
- D3.js (Data-Driven Documents)
- HTML5
- CSS3
- JavaScript
Data
The visualization includes:
- Troop movements with survivors count
- Temperature data during the retreat
- City locations with historical dates
- River locations
Inspirations
This visualization is inspired by Charles Joseph Minard's flow map, which Edward Tufte described as "probably the best statistical graphic ever drawn."
MIT Licensed