Napoleon's Russian Campaign Visualization
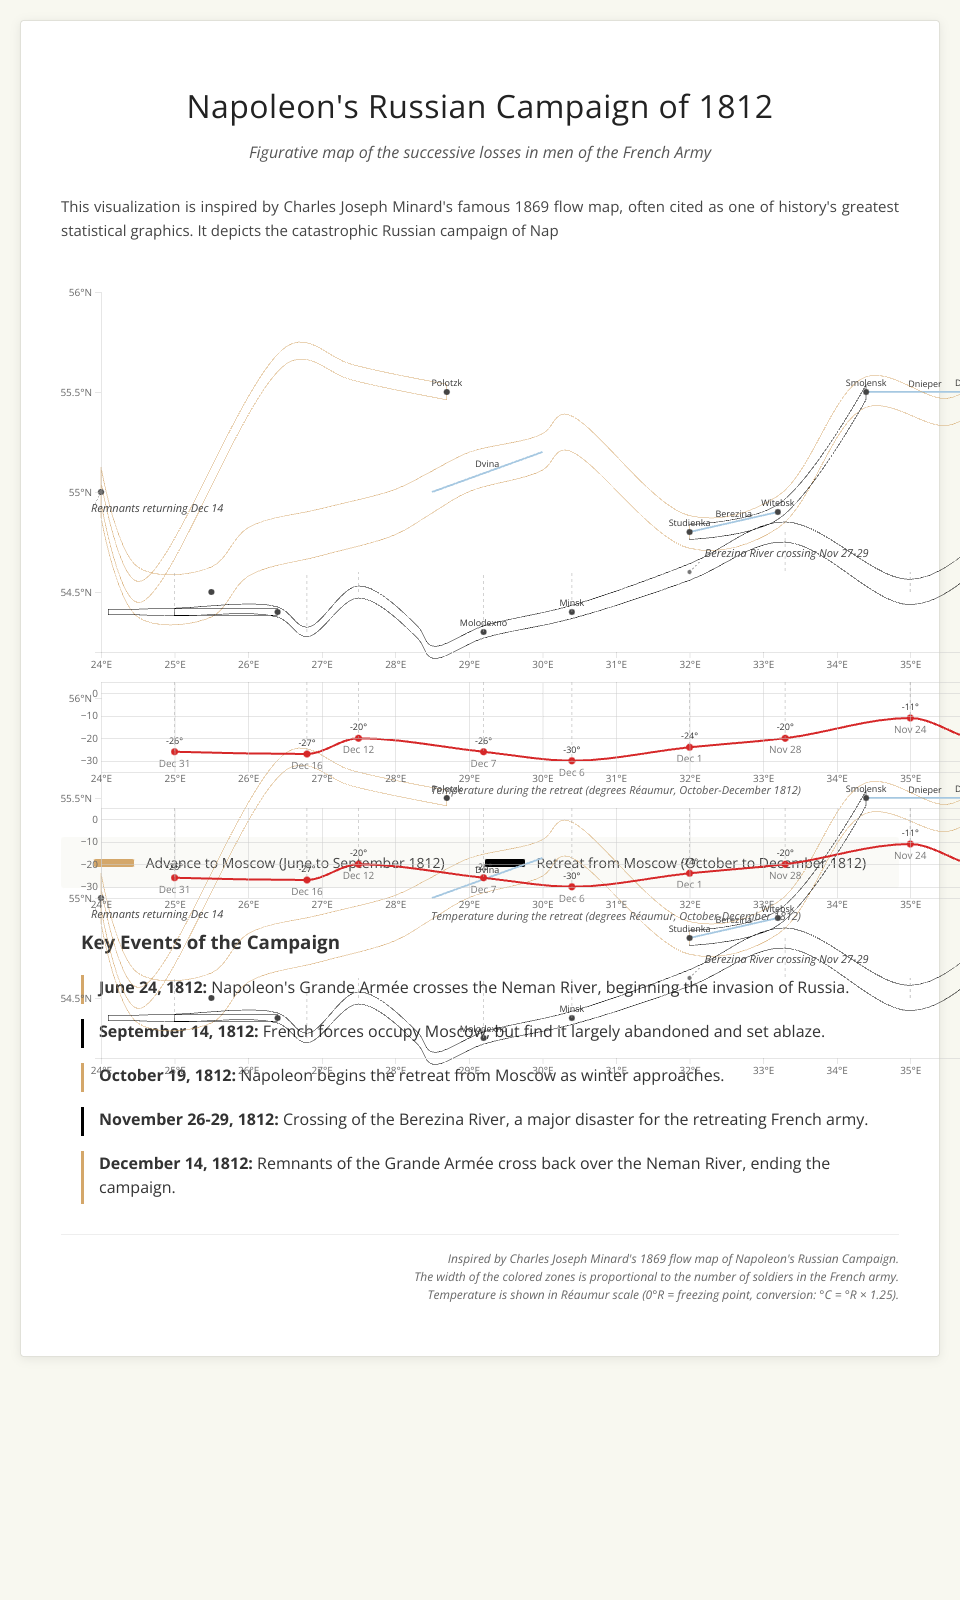
An interactive data visualization inspired by Charles Joseph Minard's famous 1869 flow map showing Napoleon's disastrous Russian Campaign of 1812. Built with D3.js.
Features
- Interactive visualization showing troop movements and losses
- Temperature chart displaying the harsh winter conditions during retreat
- City markers with historical context
- Responsive design
Implementation
The visualization uses D3.js to recreate Minard's classic visualization with added interactivity:
- Hover over troop paths to see detailed information
- Explore temperature data points
- View key dates and events of the campaign
Data
The visualization includes:
- Troop movements with survivor counts
- Temperature readings during the retreat
- Major cities and rivers
- Key historical events
MIT Licensed