Immigration Enforcement Data Analysis Dashboard
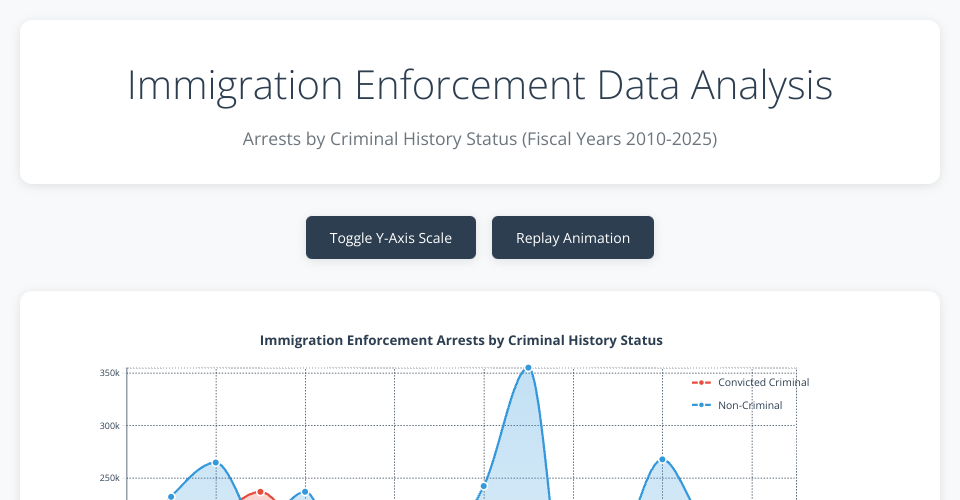
This interactive data visualization dashboard analyzes U.S. immigration enforcement arrests by criminal history status from fiscal years 2010-2025. The dashboard presents trends in arrests of both convicted criminals and non-criminals, providing insights into immigration enforcement patterns over time.
Data Overview
The visualization is based on immigration enforcement arrest data that categorizes individuals into two groups:
- Convicted Criminal: Individuals with prior criminal convictions
- Non-Criminal: Individuals without prior criminal convictions
The dataset spans fiscal years 2010-2025, with data for 2025 being partial (incomplete fiscal year).
Key Features
Interactive Visualization
- Dual-line chart showing arrest trends for both criminal and non-criminal categories
- Animated line drawing with staggered transitions for enhanced visual appeal
- Interactive data points with detailed tooltips showing exact values
- Gradient area fills beneath lines for better visual distinction
- Responsive design that adapts to different screen sizes
Dynamic Controls
- Toggle Y-Axis Scale: Switch between linear and logarithmic scales to better analyze data with varying magnitudes
- Replay Animation: Re-trigger the chart animation to highlight data trends
- Hover Interactions: Detailed tooltips displaying fiscal year, status, and arrest numbers
Statistical Insights
The dashboard automatically calculates and displays:
- Total arrests by category over the entire time period
- Percentage breakdown of criminal vs. non-criminal arrests
- Peak years for each category
- Recent trends (2022-2024 average)
Key Findings
Overall Trends
Total Volume: From 2010-2025, there were approximately 2.4 million arrests, with roughly 30% involving convicted criminals and 70% involving non-criminals.
Peak Years:
- Criminal arrests peaked in 2013 with 236,570 arrests
- Non-criminal arrests peaked in 2019 with 354,960 arrests
COVID-19 Impact: Both categories show dramatic decreases in 2020-2021, likely due to pandemic-related policy changes and operational constraints.
Notable Patterns
- 2010-2013: Steady increase in both categories, with criminal arrests growing more consistently
- 2013-2017: Criminal arrests declined while non-criminal arrests fluctuated
- 2016-2019: Non-criminal arrests showed significant growth, reaching historic highs
- 2020-2021: Sharp decline in all enforcement activities
- 2022-2024: Gradual recovery with non-criminal arrests returning to higher levels
Recent Trends (2022-2024)
- Criminal arrests have remained relatively low, averaging around 59,000 annually
- Non-criminal arrests have rebounded significantly, averaging around 228,000 annually
- The ratio has shifted further toward non-criminal enforcement
Technical Implementation
Technologies Used
- D3.js v7.8.5: For data visualization and interactive elements
- Vanilla JavaScript: For application logic and event handling
- CSS3: For modern styling with CSS custom properties and responsive design
- SVG: For scalable vector graphics that work across devices
Architecture
The application follows a modular architecture:
CriminalityChartclass: Handles all chart rendering and interactionsDashboardclass: Manages application state and data loading- Responsive design using SVG viewBox for automatic scaling
- Clean separation of concerns between visualization logic and UI controls
Data Processing
- Automatic data cleaning and type conversion
- Flexible scale handling (linear/logarithmic)
- Statistical calculations for insights generation
- Error handling for missing or invalid data
Files Structure
index.html: Main HTML structure and layoutstyles.css: Complete styling with CSS custom properties and responsive designchart.js: Chart rendering class with D3.js visualization logicmain.js: Dashboard controller and application initializationCriminalityLineChart.csv: Source data file
Usage
- Open
index.htmlin a modern web browser - The chart will automatically load and animate
- Use the control buttons to:
- Toggle between linear and logarithmic scales
- Replay the animation
- Hover over data points for detailed information
- View calculated statistics in the insights section below the chart
Browser Compatibility
This dashboard works with modern browsers that support:
- ES6+ JavaScript features
- CSS Grid and Flexbox
- SVG animations
- D3.js v7 requirements
Tested on Chrome 90+, Firefox 90+, Safari 14+, and Edge 90+.
Data Source Note
The data represents immigration enforcement arrests and reflects policy changes, operational priorities, and external factors (such as the COVID-19 pandemic) over the analyzed time period. The 2025 data is partial and represents only a portion of the fiscal year.