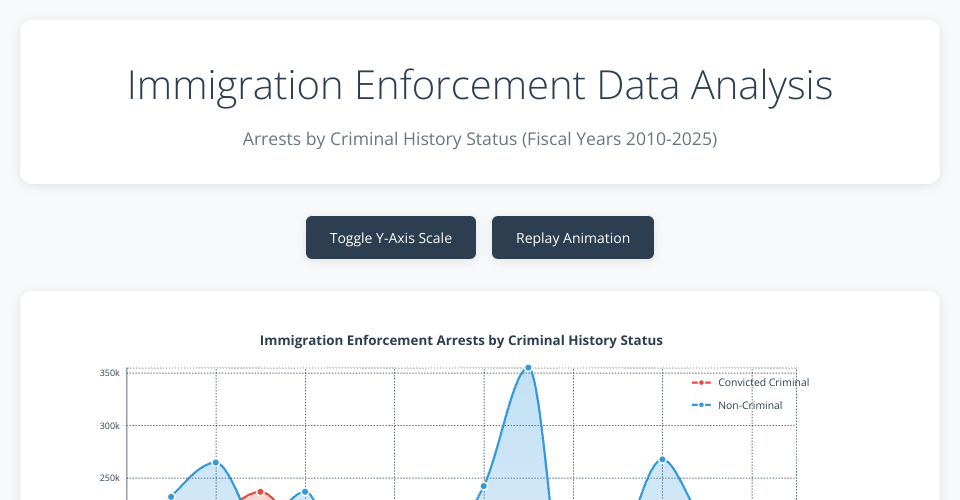
Criminality Data Visualization Dashboard
An interactive D3.js dashboard for visualizing immigration enforcement arrest data by criminal history status from 2010-2025.
Features
- Interactive Line Chart: Smooth animated line chart with hover tooltips
- Responsive Design: Fully responsive layout that works on all devices
- Area Gradients: Beautiful gradient fills under the lines for better visual appeal
- Scale Toggle: Switch between linear and logarithmic Y-axis scales
- Animation Controls: Replay chart animations
- Statistical Insights: Automatically generated key statistics and trends
- Modern UI: Clean, professional design with smooth transitions
Technical Improvements
Code Organization
- Separated concerns into multiple files (HTML, CSS, JS)
- Created reusable
CriminalityChartclass - Implemented a
Dashboardclass for application logic
Enhanced Functionality
- Responsive SVG: Uses viewBox for perfect scaling
- Better Data Handling: Robust data processing with error handling
- Smooth Animations: Line drawing animations and point reveals
- Interactive Elements: Enhanced tooltips and hover effects
- Statistical Analysis: Automated insight generation
Visual Enhancements
- Gradient Fills: Beautiful area charts under the lines
- Grid System: Subtle grid lines for better readability
- Professional Color Scheme: CSS custom properties for consistent theming
- Typography: Modern font stack and improved text hierarchy
- Micro-interactions: Smooth hover effects and transitions
Performance & Accessibility
- Idempotent Updates: Proper D3.js data joins for efficient updates
- Semantic HTML: Proper HTML5 structure
- Keyboard Navigation: Button controls work with keyboard
- Screen Reader Friendly: Proper ARIA labels and semantic markup
Usage
- Open
index.htmlin a web browser - The chart will automatically load and animate
- Use the control buttons to:
- Toggle between linear and log scales
- Replay the chart animation
- Hover over data points to see detailed information
- View automatically generated insights below the chart
Data Format
The CSV should contain columns:
Fiscal Year: Year of the dataCriminality: Either "Convicted Criminal" or "Non-Criminal"Quantity: Number of arrests
Browser Support
Modern browsers supporting ES6+ and SVG:
- Chrome 60+
- Firefox 55+
- Safari 12+
- Edge 79+
MIT Licensed