Global Arms Transfers Visualization
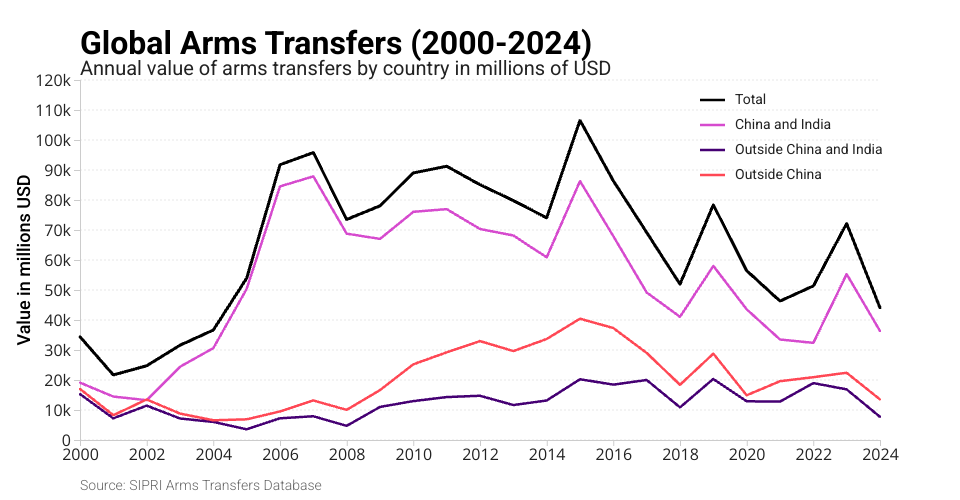
This visualization shows the annual value of arms transfers from 2000 to 2024, focusing on global totals and key regional aggregations.
The data is sourced from the SIPRI Arms Transfers Database and shows values in millions of USD.
Key Features
- Line chart showing trends over 25 years
- Interactive tooltip showing precise values for each year
- Comparison between total transfers and regional breakdowns
- Responsive design
MIT Licensed