🌍 Public
Activity-6-Question-3
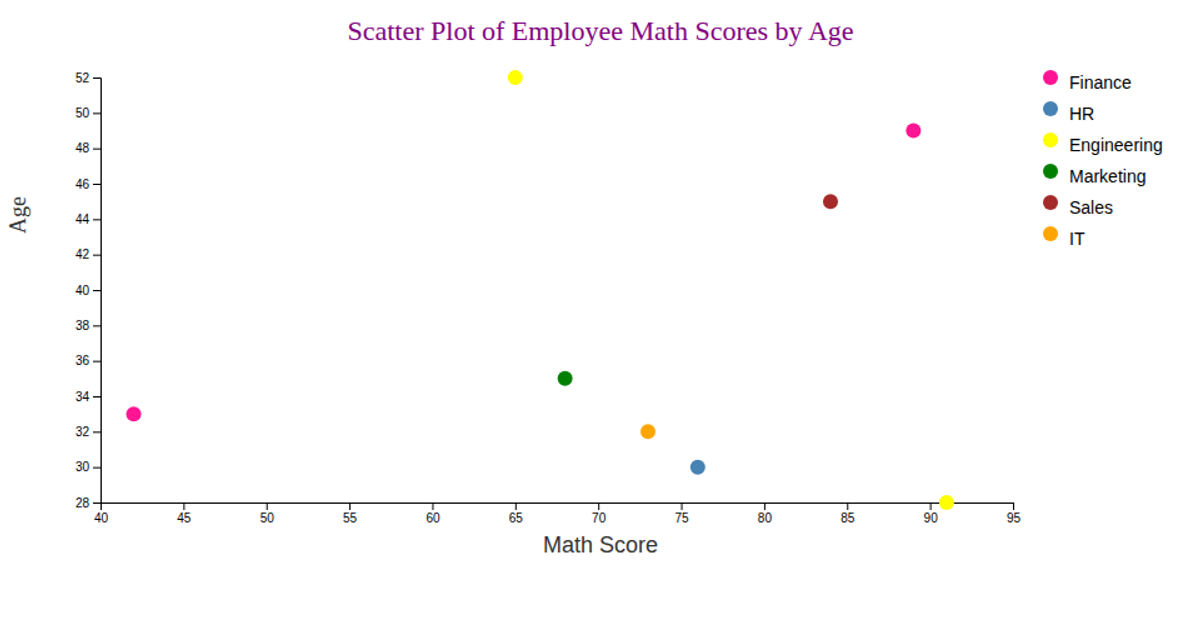
This scatter plot visualizes banking data, plotting CustomerAge against CreditScore, with the AccountType encoded by the shape of each point. A legend on the right maps these shapes to account types. The example demonstrates a modular D3 workflow, using local ES6 modules like `scatterPlot.js` and `axes.js` that import from the `d3` module. It loads data from a remote CSV, then uses `scaleLinear`, `scaleOrdinal`, and `symbol` to create the visualization.
AI-generated descriptionAn example showing the capabilities of VizHub:
- Loads D3 via UNPKG.
- Demonstrates use of
importfrom"d3". - Demonstrates use of
importfrom local ES6 modules.
MIT Licensed



Comments
Sign in to join the discussion.