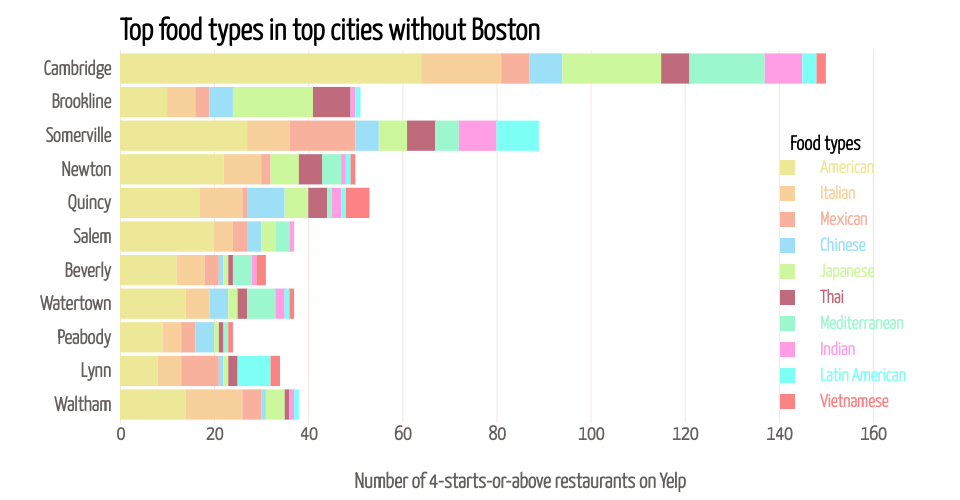
Stacked bar chart of food in cities
To address the feedback from the professor of stacked bar chart, I created a stacked bar chart of type of foods in each top cities as below. I didn't include Boston for this time as it has significantly more restaurants than others. Also I added tooltips to present amounts of restaurants of a type of food in a city when you place mouse onto any section on the bar.
Inspired by a great example of a basic stacked bar chart.
*This is a part of week 9 assignment: Address Project Feedback
MIT Licensed