🌍 Public
Untitled
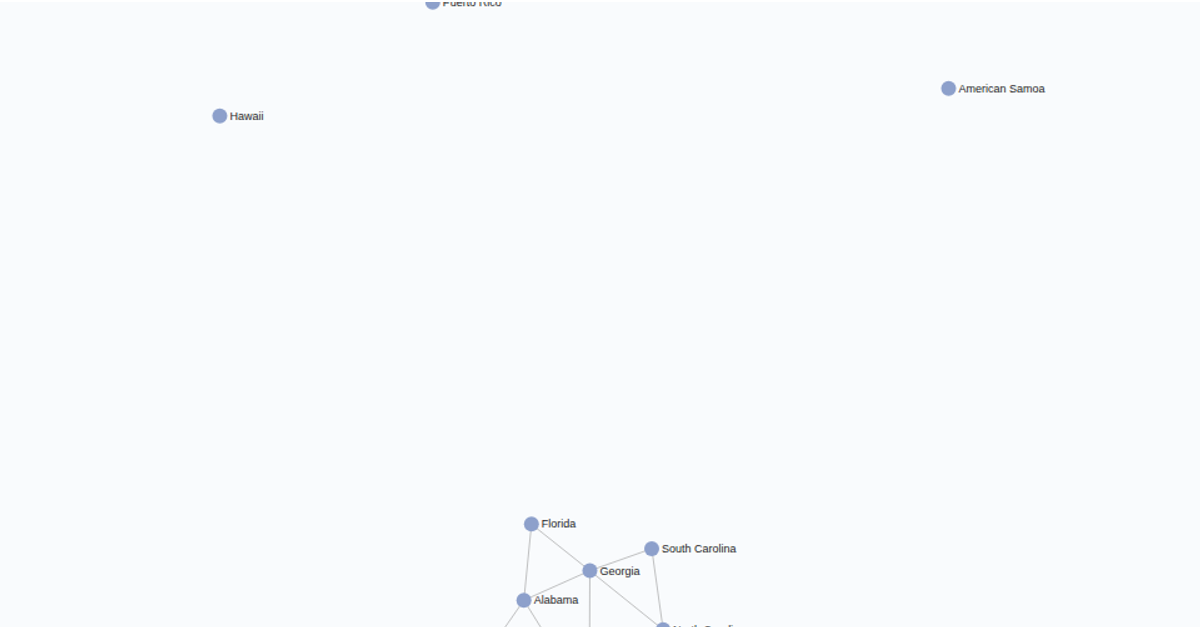
This visualization explores the relationships and spatial distribution of European countries through an interactive force-directed network. Nodes representing individual countries are positioned using d3.forceSimulation, while a static map overlay rendered with d3.geoPath provides geographic context. The code uses U.S. Census Bureau data for country boundaries and highlights connections between states, with color intensity reflecting the strength of ties. Hovering over a node triggers a transition.attrTween that smoothly scales its size and displays the country name, offering a clear bridge between abstract network topology and real-world geography.
AI-generated descriptionMIT Licensed




Comments
Sign in to join the discussion.