🌍 Public
Fork of Reusable D3 Template
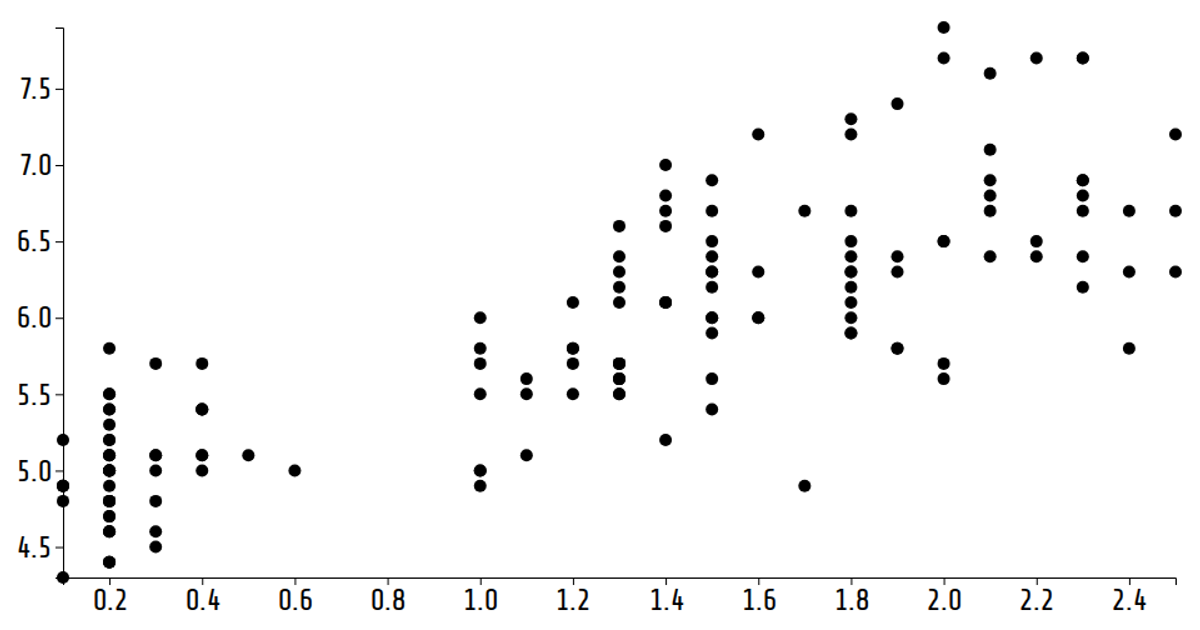
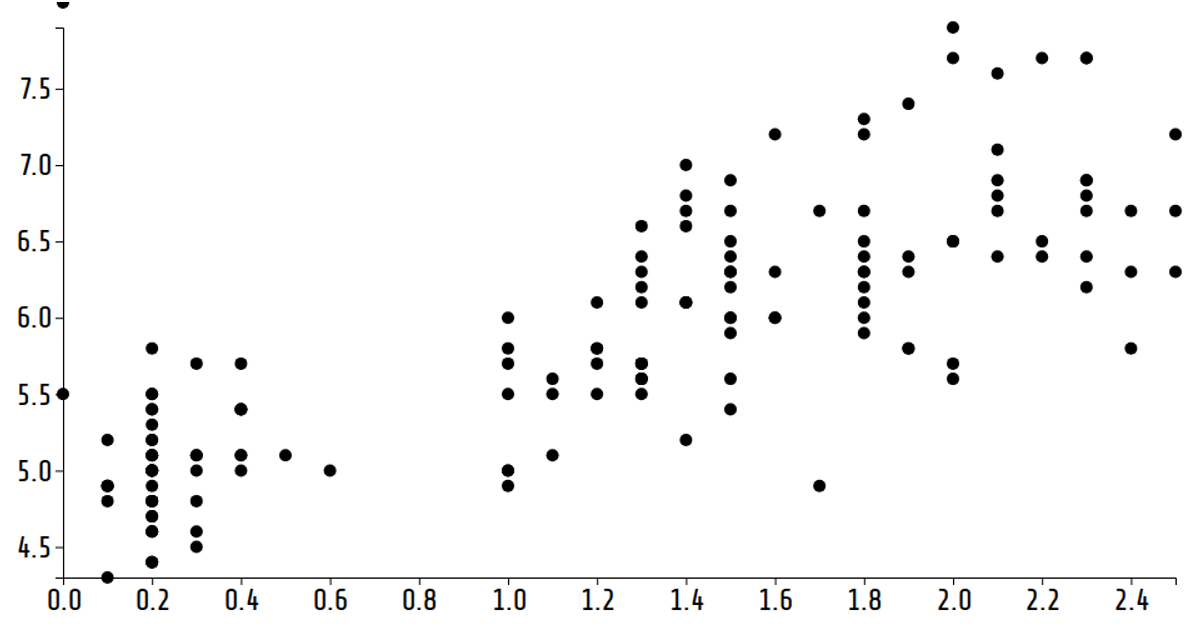
This example demonstrates a reusable scatter plot built with D3.js (v6.7.0) that cycles through different pairings of the Iris dataset's numeric columns every two seconds. The visualization renders as an animated SVG, with axes and circles redrawn as the selected x-axis variable changes. The chart’s implementation follows the “reusable chart” pattern, using a custom `scatterPlot` function that exposes chaining methods like `.width()`, `.data()`, and `.xValue()`. The data is loaded from a remote CSV file via D3’s `csv` utility, and axes are drawn using `axisLeft` and `axisBottom`.
AI-generated descriptionA reusable chart template inspired by Towards Reusable Charts.
Shows the Iris Dataset.
Shows [blood pressure over time).
MIT Licensed





Comments
Sign in to join the discussion.