🌍 Public
Swanton Choropleth Map With Interactive Filtering
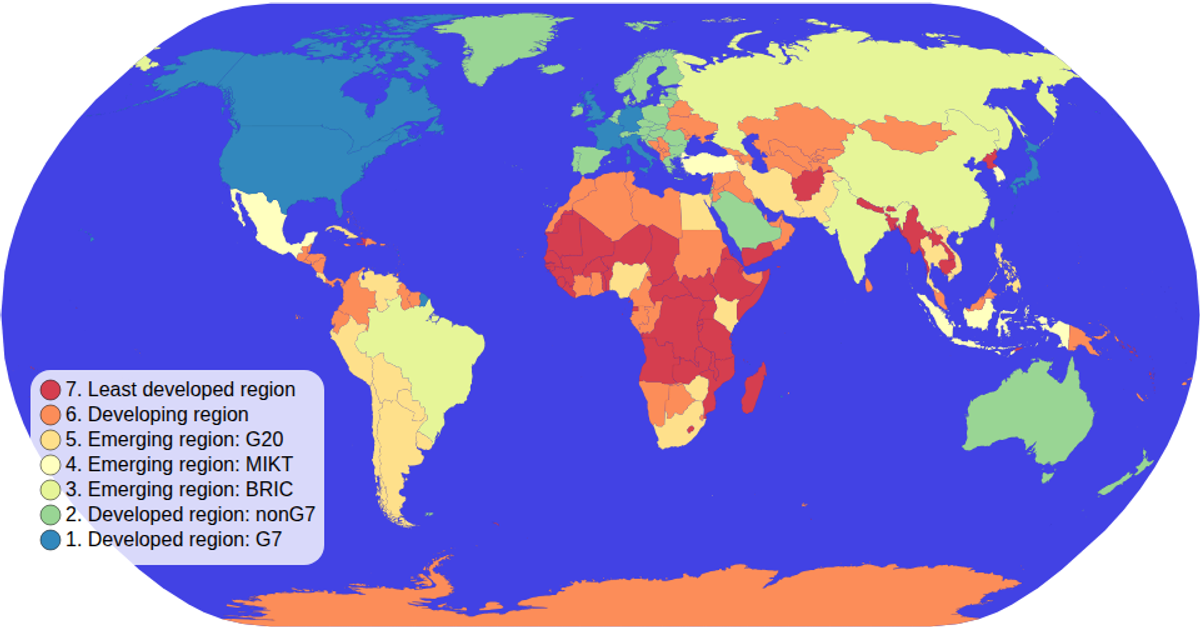
A choropleth map of the world colors each country by its economy type using a spectral ordinal color scale derived from World Atlas TopoJSON data. Interactive filtering dims non-selected countries and highlights the chosen economy when a legend swatch is clicked. The visualization uses D3 v5 APIs including `geoNaturalEarth1`, `geoPath`, and `zoom` for panning, while the legend handles click events to toggle the filter. The SVG rendering includes hover effects, tooltips, and a semi-transparent background.
AI-generated descriptionMIT Licensed





Comments
Sign in to join the discussion.