🌍 Public
Fork of Reusable D3 Scatter Plot
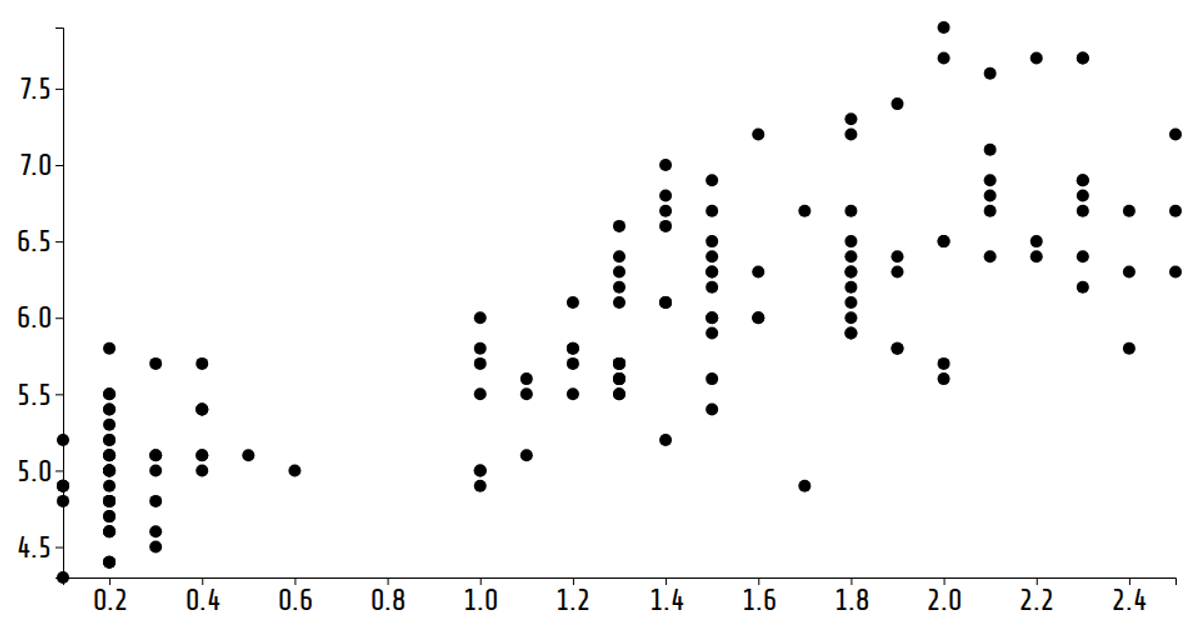
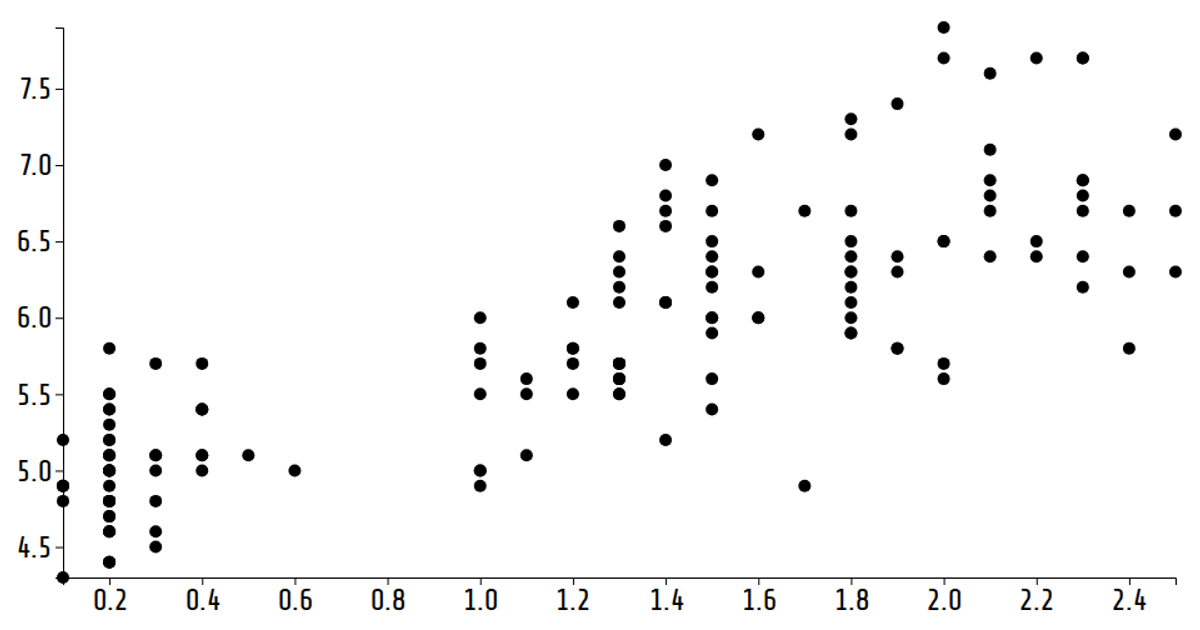
This fork of a reusable D3 scatter plot visualizes the Iris Dataset, cycling through four flower measurements as the x-axis every two seconds. The chart uses `d3.scaleLinear`, `axisLeft`, and `axisBottom` to render axes, while `d3.csv` loads the data and SVG circles display each point. Yellow points appear against a dark background with animated transitions as the axis mapping changes, driven by a `setInterval` that re-invokes the chart with a new accessor function.
AI-generated descriptionA reusable scatter plot inspired by Towards Reusable Charts.
Shows the Iris Dataset.
MIT Licensed





Comments
Sign in to join the discussion.