🌍 Public
Fork of Making A Bar Chart
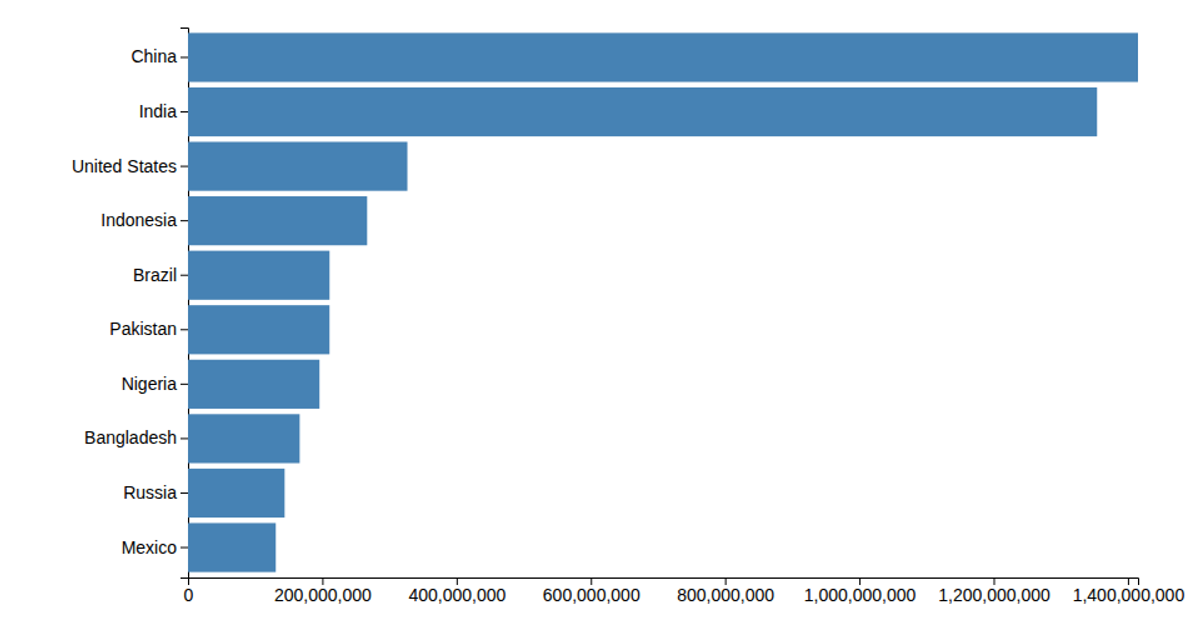
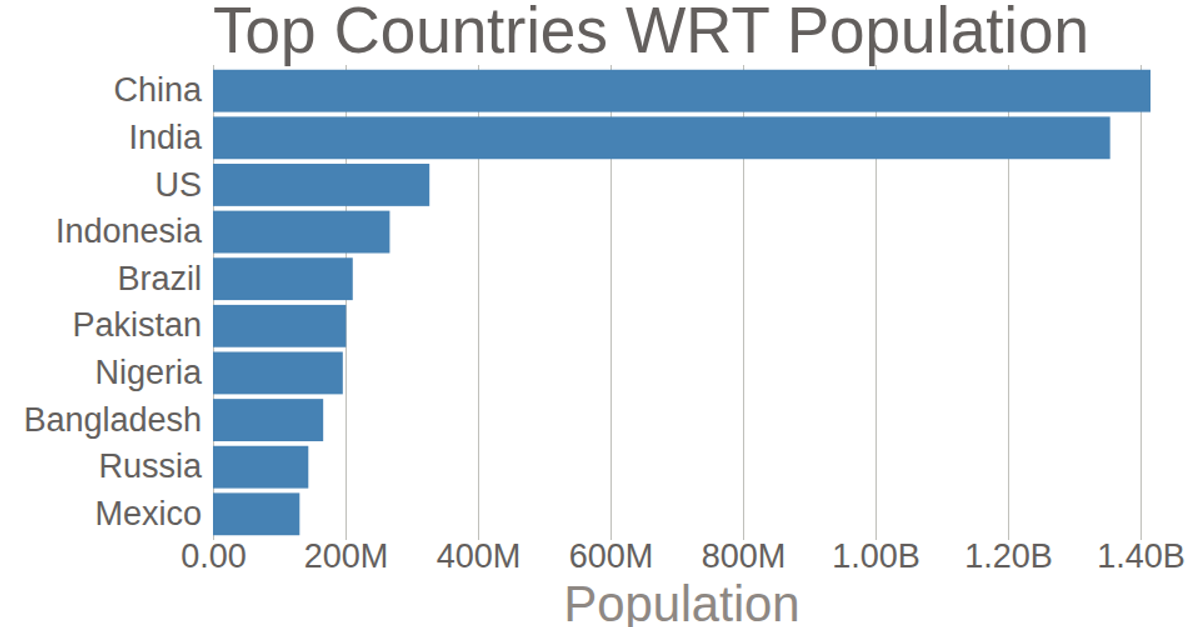
This bar chart displays the count of incidents across global regions, with North America, Northern Africa, and the Mediterranean having the highest values. Using D3 v7, the visualization loads data from a CSV file, scales the counts by 100, and renders the bars with SVG elements. The code employs `scaleLinear` and `scaleBand` for positioning, along with `axisLeft` and `axisBottom` to generate the axes.
AI-generated descriptionMIT Licensed





Comments
Sign in to join the discussion.