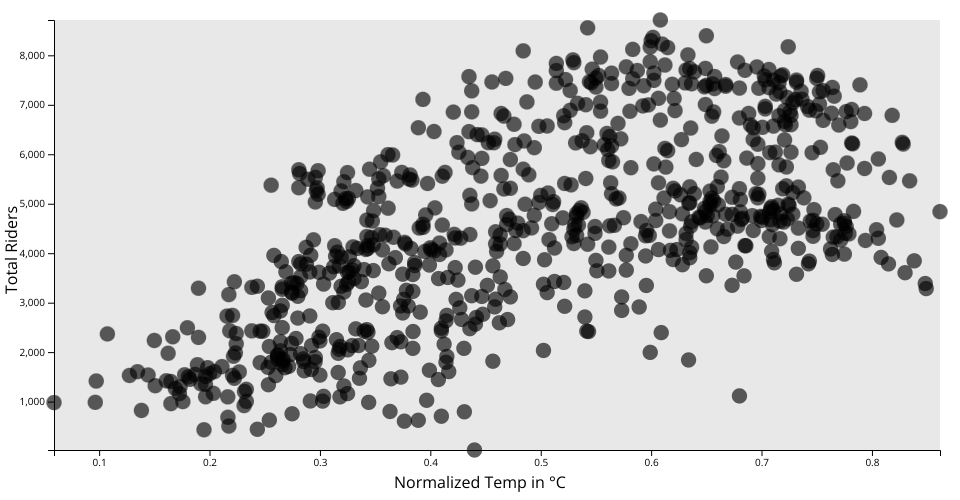
A simple scatter plot with D3 showing the Bikeshare Dataset.
All x axis values, Normalized Temp in °C, are derived via (t-t_min)/(t_max-t_min), t_min=-8, t_max=+39 (only in hourly scale)
MIT Licensed
A simple scatter plot with D3 showing the Bikeshare Dataset.
All x axis values, Normalized Temp in °C, are derived via (t-t_min)/(t_max-t_min), t_min=-8, t_max=+39 (only in hourly scale)