🌍 Public
act_6_4_task
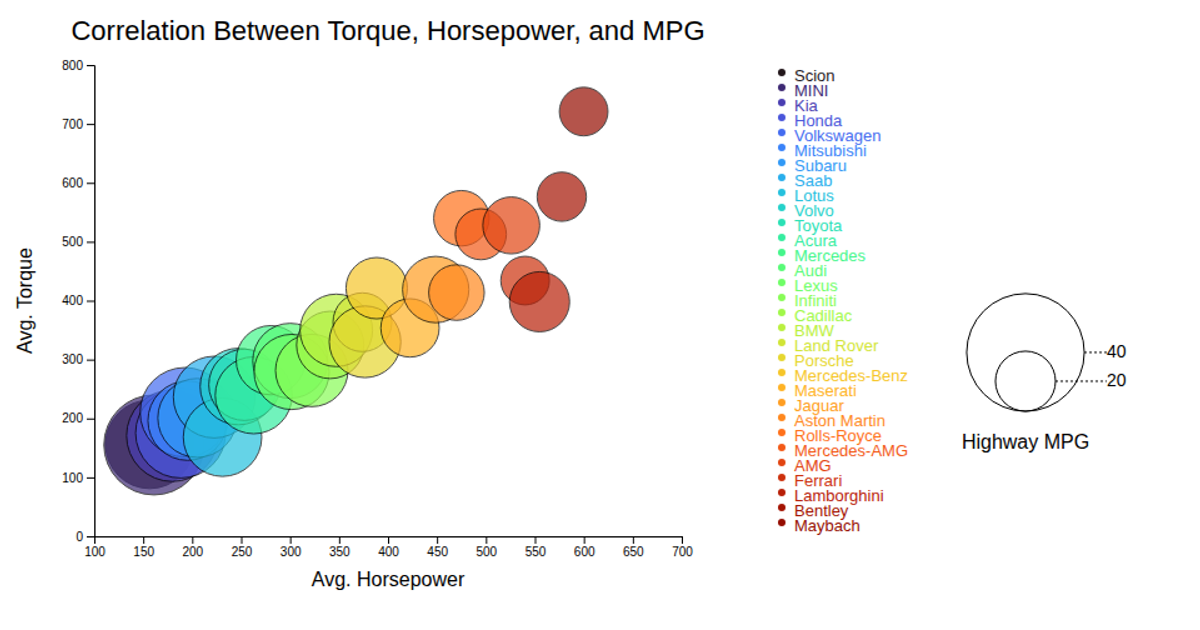
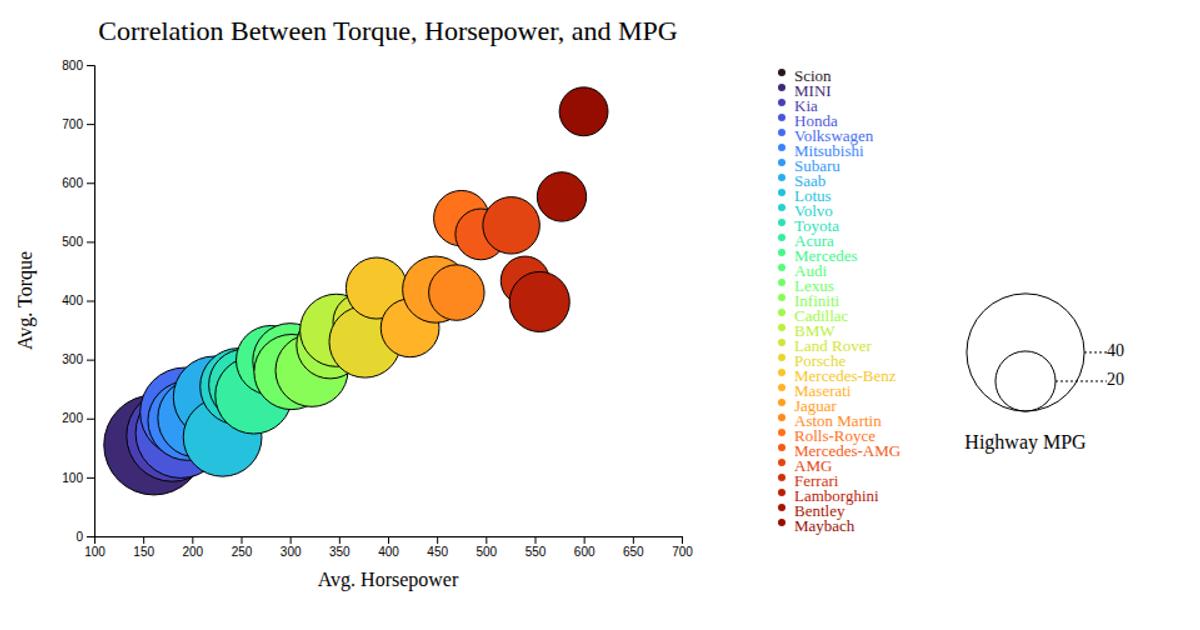
This visualization shows the correlation between average horsepower, torque, and highway MPG across car makes, with each bubble sized by MPG and colored by manufacturer. A tooltip appears on hover to display the make name. Built with D3 v7, it uses `d3.csv` to load data, `d3.scaleLinear` for axes and bubble size, `d3.scaleOrdinal` with `d3.interpolateTurbo` for colors, and `d3.axisBottom` and `d3.axisLeft` for axes. The SVG renders animated bubbles, a black tooltip, and a legend showing MPG values and color-coded makes.
AI-generated descriptionMIT Licensed





Comments
Sign in to join the discussion.